Comparing graphs is a fundamental operation in modern analytics. Whether it is to detect fraud, discover patterns in social networks, or validate technology architectures, companies need to understand how similar two structures are. Optimal transport with diffusion combines two powerful ideas: the ability to align distributions at minimal cost and the propagation of information along a graph's connections. The result is a robust, interpretable method that is especially useful in environments with incomplete or noisy data.
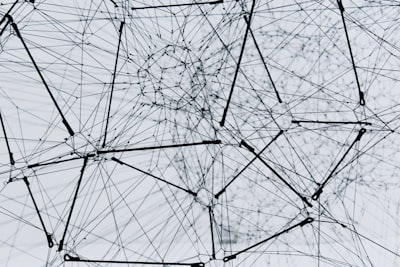
A graph is made up of nodes and edges. Nodes represent entities, and edges represent relationships. This abstraction is used in many different sectors: a process map, a collaboration network among employees, a file system, or a blockchain. When we talk about comparing graphs, we do not mean simply measuring their size or density, but understanding whether their internal structures are equivalent. For example, two distribution networks may have a different number of nodes but a similar hierarchical organization. The challenge is to capture that equivalence.
Optimal transport was born as an economic problem: given a set of factories and a set of markets, what is the cheapest way to move goods? In the graph context, this framework is used to find the best correspondence between the nodes of two graphs, minimizing a cost that depends on the distances between nodes and their attributes. The Gromov-Wasserstein variant extends the idea by comparing the internal metrics of each graph: if the distance between two nodes in one graph is similar to the distance between their counterparts in the other, the cost is low.
However, classical methods have limitations when the graph is incomplete. In reality, edges may be poorly recorded, attributes may be inconsistent, or we simply do not have all the connections. In those cases, comparison based only on local structure produces incorrect alignments. Diffusion brings a different perspective: instead of looking only at direct neighbors, we simulate how a signal would propagate from each node. This propagation reveals the global function of the graph and reduces the impact of individual connections that are missing or extra.
An intuitive way to understand diffusion is to think about a social network. If two people are not directly connected, but share many intermediary networks, information can travel from one to the other. Diffusion quantifies that accessibility. When comparing graphs, it is not enough to look at existing edges; we need to look at possible paths. Optimal transport with diffusion integrates these paths into the cost function, generating a more stable alignment.
The concept of multiple scales is key. A graph can be seen at the level of detail (individual nodes) or at the community level (groups of nodes). Diffusion allows us to explore both perspectives depending on the propagation time chosen. With short diffusion, we detect local structures. With long diffusion, we capture global patterns. Optimal transport with diffusion can combine several scales, giving it an important advantage over methods that only consider a fixed neighborhood.
This technology does not stay in the laboratory. In cybersecurity, for example, analysts need to compare attack graphs to identify whether a malicious campaign is a variant of a known one. Attack graphs are noisy by nature: hackers hide steps, remove logs, and create alternative routes. Optimal transport with diffusion helps find the common underlying structure, even when the visible evidence is fragmentary. It can also be integrated with pentesting tools and network monitoring to prioritize alerts.
Another application field is cloud infrastructure management. Microservice architectures on AWS or Azure can easily be represented as graphs: each service is a node, and calls between services are edges. Comparing these architectures allows teams to detect anomalous configurations, plan migrations, and assess availability risks. At Q2BSTUDIO, we have worked with clients managing multicloud environments that need a live inventory of their systems. Graph comparison, combined with cloud services, enables automated audits and early warnings.
In the Business Intelligence area, knowledge graphs are becoming increasingly common. A company may have a graph of customers, products, and transactions. Comparing this graph with a reference model helps detect deviations, such as a customer starting to behave abnormally or a product positioning itself differently in the market. Power BI dashboards can visualize these similarities, but the underlying calculation requires an efficient optimal transport engine. This is where custom software plays an essential role.
At Q2BSTUDIO, we are specialists in custom software development. We know that every company has a different definition of similarity and a different way of representing its data. Therefore, instead of imposing a generic solution, we design algorithms that fit the real problem. Our experience with cloud technologies and graph databases allows us to build scalable systems capable of processing millions of nodes without sacrificing accuracy.
Artificial intelligence adds an additional layer. AI agents can interpret the results of a graph comparison and explain them in natural language. For example, an agent can analyze two customer graphs, apply optimal transport with diffusion, and conclude that groups A and B share the same purchase structure but differ in seasonality. This type of automated reasoning is very valuable for sales and marketing teams. At Q2BSTUDIO, we develop artificial intelligence solutions that integrate these algorithms into decision-making workflows.
From a technical point of view, optimal transport with diffusion can be implemented using linear algebra operations on adjacency matrices and Laplacian matrices. Diffusion is calculated with matrix exponentials or iterative propagation methods. Then, the transport problem is solved efficiently with Sinkhorn-type algorithms or gradient descent on manifolds. Choosing the diffusion scale is critical and can be determined by cross-validation or entropy criteria. In real projects, we usually start with a sensitivity study to set the hyperparameters.
One of the most interesting variants is the semi-relaxed approach, which allows the nodes of one graph to move more freely than those of the other. This is useful when we compare a small reference graph with a large production graph. In these cases, we do not want to force a one-to-one correspondence, but rather allow several nodes of the large graph to align with the same node of the small graph. This flexibility improves accuracy and interpretability in asymmetric environments.
In many real situations, graphs are approximations of a more complex reality. A transaction record may have errors, a contact network may be incomplete, and a process map may be outdated. If the comparison algorithm is too strict, it will treat any missing edge as an important difference. Diffusion softens this rigidity: by propagating information through different paths, the method can infer that two graphs are equivalent even if a particular connection does not appear. This is especially relevant in environments with data integrated from different sources, where information quality is heterogeneous.
Before applying optimal transport with diffusion, it is advisable to normalize node attributes and correctly weight the importance of edges. It is also recommended to work with undirected or directed graphs depending on the problem. For example, in a money transfer network, the direction of edges is essential. On the other hand, when comparing org charts, direction may be less relevant. Good experimental design allows the algorithm to focus on semantic structure rather than on data format artifacts.
Optimal transport with diffusion is an emerging tool with enormous potential for graph comparison. Compared with traditional methods, it offers greater tolerance to noise and a better capture of structural patterns. For companies, this means being able to make decisions based on the real similarity of their systems, not on a superficial view of their connections. Combining this technique with custom software, cloud infrastructure, cybersecurity, Business Intelligence, and artificial intelligence opens the door to a new generation of analytics platforms.
At Q2BSTUDIO, we are ready to accompany this journey. Our team combines applied mathematics, software engineering, and digital transformation experience. If your organization needs to compare graphs robustly, or if you simply want to explore how optimal transport can improve your analytics, we can help you design a solution that fits your business. After all, the true competitive advantage lies not in having more data, but in understanding the relationships that connect it.