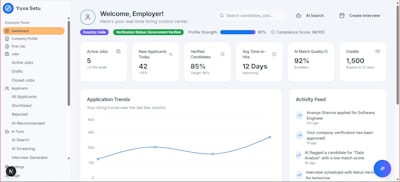
Measuring the success of an enterprise software solution goes far beyond checking whether the application is delivered on time. A solution that arrives on schedule and within budget can still fail if it does not solve the business problem it was created for. Therefore, KPIs (key performance indicators) are the compass that guides every decision: from choosing the architecture to prioritizing features. Defining them well means understanding what must change in operations, what pain point will be removed, and what concrete value the organization expects to gain.
Every company has a different context. A solution for the logistics sector may focus on reducing delivery times, while a tool for financial services may prioritize traceability and regulatory compliance. For this reason, before designing any system, it is necessary to carry out a process and opportunity analysis. At Q2BSTUDIO, for example, we work with internal teams to identify bottlenecks and map data flows, so that custom software development is based on a real view of operations rather than assumptions.
A good measurement framework combines outcome indicators with process indicators. The former report on final impact, such as generated revenue or improved margins. The latter make it possible to detect deviations in time, such as increases in response time or drops in productivity. The key is to balance both types to have a forward-looking and retrospective view at the same time.
The first dimension any company should consider is business impact. This includes metrics such as operating cost, profitability per customer, average order value, and time to launch new products or services. A software solution must help these figures improve steadily. For example, a sales platform with automated business rules can reduce the time required to prepare a quote from days to hours, which directly affects conversion rate. In this type of project, financial metrics should be defined from the start, with a clear baseline and a return projection.
The second dimension is operational efficiency. It is not enough for the software to work; it must optimize people's work. Typical indicators are process cycle time, volume of transactions handled, percentage of automated tasks, and number of manual interventions required to complete an operation. When a company integrates AI agents into workflows, for example, it can automate incident classification, data extraction from documents, or generation of preliminary reports. This frees up team time for higher-value activities and reduces errors associated with repetition.
The third dimension is user adoption and experience. Software can be technically impeccable, but if people do not use it, value is diluted. Therefore, it is worth measuring the number of active users, frequency of use, time spent on each feature, task completion rate, and qualitative evaluations from employees. Short in-app surveys, behavior analytics, and end-user interviews provide information that quantitative data does not always reveal. Customer or employee experience should itself be a KPI, because productivity and reputation depend on it.
The fourth dimension relates to technical quality and security. We are talking about availability, response times, error rates, frequency of critical incidents, and mean time to recovery. A system that frequently interrupts operations destroys trust and creates invisible costs. Moreover, cybersecurity should not be treated as an add-on; it is part of the definition of success. Unpatched vulnerabilities, unauthorized access, or data leaks can cancel out any benefit obtained through digitalization. For this reason, it is advisable to include security indicators in the dashboard, such as the number of vulnerabilities detected, remediation time, or the percentage of systems with multi-factor authentication.
The fifth dimension is business intelligence. Enterprise software generates a large amount of data that, when turned into useful information, supports better decisions. This is where indicators such as data quality, dashboard coverage, information refresh time, and number of data-driven decisions come into play. Business Intelligence and Power BI platforms help visualize all this knowledge in real time. At Q2BSTUDIO we integrate these capabilities so that KPIs do not remain in static reports but become actionable alerts and diagnostic tools.
The sixth dimension is scalability and innovation. Software created today must be able to grow with the business and integrate with emerging technologies. It is necessary to evaluate architecture, coupling between modules, ease of adding new features, and maintenance cost. Cloud migration is an important enabler. AWS and Azure infrastructures offer elasticity, high availability, and artificial intelligence services that can be incorporated gradually. In this sense, innovation KPIs measure the time required to bring a new feature to market, the percentage of systems integrated in the cloud, or the level of deployment automation.
Defining KPIs is only the first step. For a measurement system to be useful, you must establish review frequency, owners for each indicator, and the data extraction mechanism. A KPI without a reliable data source is an opinion, not a metric. Consequently, it is necessary to invest in instrumentation: activity logs, data pipelines, dashboards. Q2BSTUDIO often builds customized dashboards that connect data sources with executive dashboards, so managers can see both forward-looking indicators and final outcomes. This comprehensive view facilitates conversations between business and technology.
A frequent mistake is accumulating dozens of indicators and ending up with a dashboard full of numbers that no one knows how to interpret. What matters is not quantity but quality. A small number of well-chosen KPIs, understood by the organization, has more impact than an exhaustive list of technical metrics. It is also wise to review them periodically, because objectives change. An indicator that was relevant at product launch may stop being relevant when the market matures. Agility in KPI management is as important as agility in software development.
Another recommended practice is to combine objective data with people's perception. Numbers explain what is happening, but not always why. User interviews, focus groups, and climate surveys help interpret figures. When a productivity KPI drops, it may be due to an unintuitive interface, insufficient training, or a process change that was not communicated properly. Only an analysis that integrates data and context makes it possible to correct course effectively.
Artificial intelligence is redefining the way we measure success. Today it is possible to analyze large volumes of data to detect patterns, predict behaviors, and recommend actions. AI agents can continuously monitor KPIs, alert about deviations, and even suggest adjustments to software configuration. This predictive capability turns measurement into a proactive tool, not a historical review. Companies that incorporate these solutions gain a clear competitive advantage, because they can react before a problem becomes a crisis.
Ultimately, measuring the success of enterprise software solutions is an exercise in leadership. It requires clarity about objectives, honesty in data, and discipline in decision-making. It is not about finding a perfect metric, but about building a continuous improvement system that involves all areas. Technology provides powerful tools, but only the commitment of the human team turns them into sustainable results.
Q2BSTUDIO supports organizations throughout this journey. From designing digital strategy to implementing cloud-based solutions, artificial intelligence, and automation, we help ensure that every software investment generates measurable impact. If you are defining KPIs for a project or need to redesign your company's data architecture, the starting point is understanding what change you want to bring about in your business. From there, indicators become the common language that aligns technology and strategy.