When a company commissions the development of a web application, one of the first questions that usually arises is whether the project includes dashboards and reports. The answer is not automatic: it depends on the type of application, the end user and the business goals. However, in most enterprise developments data is the central asset, and without a visualization layer it becomes very difficult to make operational and strategic decisions. A dashboard is not a simple decorative addition; it is the interface that turns raw data into actionable knowledge.
To understand this better, it is useful to distinguish between a corporate website and a business web application. The former displays static information; the latter manages processes, records transactions, queries databases and serves different types of users. In that context, reports are core functionality. An invoicing application needs reports on collections, taxes or aging balances. A customer service platform needs metrics for resolution, satisfaction or waiting times. A supplier portal needs compliance and quality indicators. Dashboards and reports are not optional when the application has to answer specific business questions.
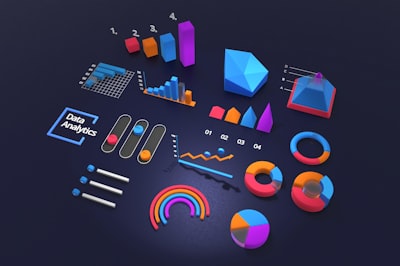
There are different levels of analytics that a web development company can implement. The first are usually executive dashboards, which summarize the organization's key indicators. Then there are operational reports with filters, groupings and detail to analyze problems. There are also scheduled reports sent by email or to internal channels, and interactive panels that allow users to explore information. In more advanced projects, analysis is enriched with predictive models or automatic alerts when a metric deviates from what was expected. Each of these formats has a different purpose and requires specific design.
When we talk about custom software, analytics must adapt to the business logic, not the other way around. A generic solution usually imposes a rigid data structure; a custom development allows indicators to be modeled from real company rules. For example, profitability calculations may depend on internal costs, discounts, returns or campaigns. A good development company knows how to translate those rules into queries, metrics and visualizations. That is why, rather than an accessory module, the dashboard should be considered part of the product design.
Integration with Business Intelligence platforms is also important. Many companies have already invested in tools such as Power BI, Tableau or similar. The web application should not become a data silo. Ideally, it should offer APIs, exports or direct connections to corporate BI. At Q2BSTUDIO we regularly work with Business Intelligence and Power BI services so that reports generated inside the application coexist with the rest of the company's information. This avoids duplicating dashboards and provides a single view of the business.
Performance is another critical factor. A report that loads slowly or blocks the application can ruin the user experience. To avoid these problems, the architecture must properly separate the operational database from analysis processes, or use caching and aggregation layers. In projects with high data volumes, the AWS/Azure cloud infrastructure offers managed services for storage, processing and analytics. A development supported by cloud can scale horizontally when the number of users or the data history grows, without having to redesign the application. It is a technical decision that ultimately conditions the usefulness of the reports.
Artificial intelligence is changing what we understand by a report. Classic dashboards show numbers and charts; new systems incorporate assistants that understand natural language questions. For example, an operations manager can type a question such as which orders have been delayed this week? and get a reasoned answer instead of a table without context. These assistants, built as AI agents, not only query data: they detect anomalies, explain trends and suggest actions. This type of functionality is becoming a real differentiator for companies that want to take advantage of their data.
AI agents and predictive reports require careful design. The quality of the model depends on the quality of the data, and the data is often scattered among the application, the ERP, the CRM and other tools. A professional development includes a data governance phase: definition of sources, cleansing, transformation and auditing. This is where an experienced company brings value, because adding a flashy chart is not enough. It is necessary to guarantee that the metric each user sees is consistent and up to date. Q2BSTUDIO integrates these processes with a practical vision, focused on making the end user trust what they see.
Security is also part of any reporting project. A panel can show financial data, personal customer information or sensitive internal metrics. If the application does not properly control who sees what, it becomes a risk. Good cybersecurity practices include strong authentication, role-based access control, encryption of data in transit and at rest, access logging and protection against common attacks. At Q2BSTUDIO we apply these criteria in every development, so that dashboards are not only useful but also secure. Digital trust is not improvised.
In addition to internal reports, an application can generate reports for external customers. A customer portal, for example, can show the status of their orders, the consumption of a service or the billing history. In these cases, the visual design must be clear, and the permission logic must prevent one customer from seeing another customer's information. This modality, sometimes called embedded analytics, is very useful for increasing the perceived value of the product. The user does not need to export data to understand their situation; the application shows it at the exact moment of the query.
Reports are also essential in process automation projects. When a company automates administrative, commercial or production tasks, it needs to measure whether the automation works. Indicators such as time saved, error rate, bottlenecks or cost per process are essential to justify the investment and improve it. A web development company that understands business processes can design those indicators together with the automation logic. The result is a system that not only executes actions but also demonstrates its impact.
At Q2BSTUDIO we understand software creation as an integral process. We work with companies to develop custom software that includes everything from data modeling to the final interface, including AWS/Azure cloud integration, connection to CRMs and ERPs, analytics and security. Our team combines technical profile and business vision, because a report only makes sense if it responds to a specific decision. That is why we ask before programming: what each role needs to know, how often and with what level of detail.
A good methodology also influences the quality of the reports. The project should start with a requirements workshop where the processes and decisions that the application must support are defined. From there, a data model is built and indicators are validated with users. Then sources are integrated, queries are developed and the most complex scenarios are tested. Launch is not the end: reports evolve with the business. For this reason, it is advisable to leave a maintainable technical base, with clear APIs and documentation, so that metrics can be adapted without breaking the application.
So does a web development company include dashboards or reports? The answer will depend on the contracted scope, but any serious project should consider them at least as an option. A web development without analytical capabilities limits the growth of the organization. The data that the application generates every day is too valuable to ignore. Integrating dashboards, operational reports, BI, cloud and artificial intelligence is a strategy that turns an operational application into a management tool. That is the level of service that defines a technology partner, not a simple code provider.
If you are evaluating a project, it is worth asking the development team how they plan to solve the data layer: which indicators are included, which BI tools are integrated, how sensitive information is protected and whether the system is ready to incorporate AI in the future. Those answers mark the difference between an application that works and an application that transforms the business. Q2BSTUDIO can help you answer them with a practical approach, focused on results and the continuous evolution of your platform.