1. The intranet paradigm shift. In 2026, a corporate intranet can no longer be understood as a simple file repository. Distributed teams, multidisciplinary groups, and today's decision-making pace require employees to find answers, not documents. A knowledge graph adds a semantic layer that connects people, projects, clients, processes, and content. Search stops being a list of results and becomes a contextual answer: the system understands what each person needs, with which permissions, and at which moment.
2. The real value of the graph. The real value of this approach lies in knowledge automation. When an employee asks about an internal policy, the graph doesn't just find the PDF; it identifies the current version, the owner, the exceptions, and the approval flow. That same semantic model feeds AI agents that can summarize, compare, classify, and in certain cases execute tasks. That is why comparing intranet solutions with knowledge graph in 2026 forces us to look far beyond visual design.
3. A comparison method. This guide proposes a comparison method based on six dimensions: data model, architecture, integration, security, AI governance, and measurability. The goal is to avoid decisions based on attractive demos and focus on what really generates return: quality of answers, adoption rate, and reduction of manual work.
4. Data model. The first dimension is the data model. Every knowledge graph solution relies on ontologies, that is, an explicit definition of entity types and their relationships. A serious provider must explain how that model is fed: is it built automatically from existing sources, curated manually, or a combination of both? The answer conditions maintenance and sustainability. If the ontology is rigid, the project will fail when scaling. If it is too loose, answer quality will decline.
5. Technical architecture. The second dimension is technical architecture. A knowledge graph does not work well with closed solutions and black boxes. It needs robust persistence, indexing services, secure APIs, and a front end adapted to real workflows. This is where custom software makes the difference compared with generic products: it adjusts the data model, interface, and business rules without waiting for features that may never arrive. Flexibility must therefore be the first technical filter.
6. Integration with the ecosystem. The third dimension is integration with the existing ecosystem. Organizations already use Microsoft 365, Google Workspace, SAP, Salesforce, HubSpot, Odoo, or proprietary tools. A knowledge graph intranet must coexist with all of them, not replace them. In practice, the most valuable projects combine native connectors, APIs, and an integration bus that synchronizes identities and events. In addition, the infrastructure can rely on AWS/Azure cloud to scale processing and guarantee high availability.
7. Security and compliance. The fourth dimension is security and compliance. By centralizing sensitive knowledge, the graph becomes a critical target. Role-based access control, SSO authentication, encryption in transit and at rest, and audit trails for each query must be evaluated. Enterprise solutions must also include data governance mechanisms. Cybersecurity is not an add-on; it is a starting condition. Penetration tests, dependency reviews, and a clear incident response plan should be required.
8. AI governance. The fifth dimension is AI governance. A knowledge graph reaches its full potential when combined with generative models and AI agents. To keep that combination safe, the system must control prompts, limit the data each model can access, anonymize personal information, and keep a human in the loop for relevant decisions. Q2BSTUDIO approaches this layer with its own know-how and with the AI tools that best fit each architecture, including private deployments on Azure or AWS.
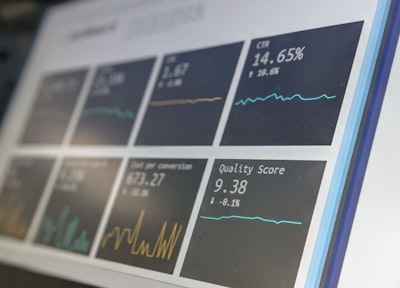
9. Measurement and BI. The sixth dimension is measurability. A knowledge graph is not an end in itself. It is necessary to know whether it reduces search time, improves employee onboarding, accelerates internal processes, and decreases the number of incidents. This measurement requires real-time dashboards and, when the organization already invests in business intelligence, a clean integration with tools such as Power BI and other BI developments. Knowledge data becomes business indicators.
10. Selection methodology. How does this translate into a selection process? A good methodology starts with a discovery phase in which the provider understands workflows, data sources, and operational constraints. Then it must prioritize use cases with measurable impact, avoiding the mistake of trying to cover the whole company knowledge from day one. Phased deliveries allow validating the model with a pilot group, correcting course, and scaling with evidence.
11. Q2BSTUDIO as a technology partner. Q2BSTUDIO is a software development and technology company that applies this approach to knowledge graph intranet projects. Its main value is not a closed product, but the ability to build a tailored solution that integrates AI, automation, and security. The team combines software architects, data engineers, cloud specialists, and business analysts. That makes it possible to answer with facts the question every steering committee should ask: what will change in our business and how will we measure it?
12. Real-world results. In practice, a company with thousands of employees can dramatically reduce time spent searching for internal information. A support team can resolve incidents using answers generated from official documents, without depending on colleagues' memory. HR can deliver a personalized onboarding experience. And management can detect bottlenecks before they affect customers. These results are achieved not only with technology, but with rigorous implementation.
13. Validation with real data. When comparing providers, a proof of concept with real data is essential. A marketing video is not enough: you need to see how the solution understands real documents, how it handles permissions, and how it behaves with ambiguous questions. References from similar projects and a clear explanation of technical decisions are also required. Transparency in architecture is a sign of maturity.
14. Budget and return. The budget for this type of initiative depends on data maturity, number of integrations, and desired automation level. The most efficient approach is to split investment into phases: a first phase to solve a concrete problem, and later phases to expand the graph to other departments. This way, return materializes incrementally and risk remains under control.
15. Conclusion. In conclusion, the knowledge graph intranet should be evaluated as a knowledge and automation platform, not as a simple portal. Organizations that get it right combine a solid data model, flexible architecture, deep integration, security by design, and clear dashboards. Q2BSTUDIO helps define that roadmap and execute it with measurable results. The decision is not only technological: it is a decision about competitive capabilities for the coming years.