An intranet with a knowledge graph is not a technological luxury. It is a natural evolution for companies that can no longer manage their information with basic search tools. A knowledge graph models relationships between entities in the organization. So, when someone searches for information about a client, the system not only finds the file, but knows who approved it, in which project it was used, which ERP system generated the data and which employee is responsible for that area. That contextual understanding is what allows AI to provide useful answers.
There are objective signs that the time has come. One is average search time. In many companies, finding a relevant document can take more than ten minutes, and in the end no one has a guarantee that the version is the final one. Another sign is knowledge turnover: when a person leaves the company, part of their expertise disappears with them. An intranet with a knowledge graph turns those individual experiences into accessible assets.
Another symptom is the proliferation of spreadsheets to compensate for deficiencies in official systems. This way of working generates duplicate data and reconciliation errors. Conversely, when the graph is connected to transactional systems, all departments work with the same entities and relationships.
In practice, the graph is built on a database designed for relationships, but its value appears when it is combined with integration services. Q2BSTUDIO approaches these projects with a combination of custom software development, AI, cybersecurity and AWS/Azure cloud. This means that the client does not receive a closed platform, but a solution that fits their processes and can evolve. When current systems do not cover a specific workflow, the most robust path is usually custom software development, since it allows every screen, business rule and integration to be adapted to the company's reality.
AI agents, for example, can connect to the graph to perform specific tasks: classify emails, prepare meeting summaries, update master data or detect anomalies in a process. Each agent operates within a defined perimeter, with the appropriate credentials and an activity log. They do not replace employees in complex decisions, but they drastically reduce routine tasks.
Information security cannot be left halfway. Good practices include federated authentication, role-based permissions and encryption of data in transit and at rest. When AI needs to access internal systems, it is recommended to establish private channels such as VPN or Azure Private Link to prevent data from leaving via the public internet. For AWS deployments, a private VPC with secure endpoints can also be used.
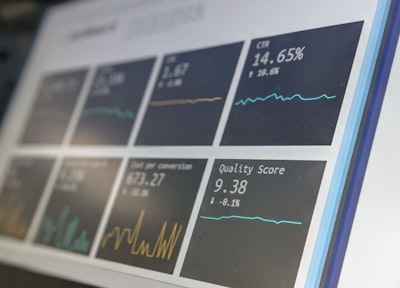
The same graph feeds dashboards. A BI/Power BI layer can show not only aggregate metrics, but also explain the full journey of an operation. For example, a manager can see how long an invoice takes from approval to payment, which employees participated, what exceptions occurred and in which systems the delay originated. Without the graph, that traceability is almost impossible to obtain.
Cloud infrastructure facilitates this level of connection. AWS and Azure offer graph database, machine learning and identity services that reduce technical effort. Q2BSTUDIO helps choose the most appropriate architecture according to industry, data volume and budget, avoiding overruns and unnecessary processes.
If the company has not yet defined its AI strategy, it can start with a pilot on a specific use case. An Artificial Intelligence project applied to the intranet can demonstrate in a few weeks what impact contextual search has on productivity. Based on that evidence, it is easier to expand the solution to other processes.
With all this, the decision to invest in a knowledge graph intranet should be based on the relationship between the cost of the problem and the cost of the solution. If the company is scaling, adding teams or integrating new companies, urgency increases. If the sector is regulated and requires auditing of who accesses what information, urgency also increases. If customers complain about errors or lack of response, the cost of doing nothing is obvious.
An important advantage is that not every system needs to be replaced. The graph is designed to coexist with current applications: ERP, CRM, SharePoint, Teams and custom APIs. Integration can be done in phases so that operations do not stop and risk is controlled.
The implementation process usually follows an order. First, a discovery phase to understand the business and critical workflows. Then an MVP with a limited scope is defined to demonstrate value. Next, corporate systems are integrated and AI agents are deployed. Finally, impact is measured and models and rules are adjusted.
Measurable results include reduced onboarding time, fewer internal emails asking where things are, administrative processes with less manual intervention and managers with a more realistic view of operations. These are not intangible benefits; they can be translated into freed-up hours, fewer compliance errors and greater responsiveness to customers.
In short, a knowledge graph intranet makes sense when knowledge is a critical asset and daily operations need fast, secure and contextual answers. If your team is still losing hours on tasks that a system could solve, this approach deserves analysis. Q2BSTUDIO supports companies in that process, from use case definition to production deployment, with a combination of software development, AI, cloud and cybersecurity.