Sustainability is no longer an optional add-on in the corporate agenda: it is a competitive lever. Companies that embed environmental criteria into their daily operations gain advantages with regulators, investors and customers. However, turning environmental goals into measurable results requires more than good intentions. It demands a digital infrastructure capable of capturing data, relating it and making it available to teams at the critical moment. That is where an intranet with knowledge graph becomes a strategic accelerator.
A knowledge graph organizes information as a map of connected entities: projects, people, documents, indicators, risks and evidence. In an enterprise intranet, this semantic approach overcomes the limitations of traditional repositories, where information sleeps in silos and searches return flat lists. With a graph, users see the full context of each element, discover non-obvious relationships and make decisions with a comprehensive view. For the sustainability area, this means being able to answer complex questions: which initiatives are really contributing to CO2 reduction? Which teams are falling behind? Which suppliers fail to meet environmental criteria?
The connection to environmental goals is direct. To reduce emissions, optimize waste or improve energy efficiency, teams need to know what is being done, who is doing it and with what impact. An intranet with knowledge graph enables building a live dashboard of sustainable initiatives, where each project is linked to its KPIs, budgets, owners and supporting documents. This traceability is the foundation for audits and reports under frameworks such as GRI or SASB. Additionally, by relating all elements, the system can detect overlaps or gaps in the strategy, something impossible to achieve with a simple list of projects.
To achieve this vision, software must adapt to the real processes of each organization. Generic platforms often fall short when it comes to integrating scattered environmental data or modeling complex relationships. Therefore, a custom software strategy allows designing an intranet that reflects the company's culture, workflows and language. Far from starting from a rigid template, it builds a system that evolves with business needs and can connect to existing corporate systems such as ERP, CRM or data platforms.
Artificial intelligence amplifies the value of the knowledge graph. AI algorithms can automatically enrich the graph by extracting entities and relationships from documents, emails or meeting minutes. They can also provide natural language answers, allowing an executive to ask 'which carbon reduction projects are at risk?' and receive an evidence-based answer based on current data. When these models are combined with AI agents, digital assistants can even suggest actions, alert about deviations or generate drafts of environmental reports. A well-trained agent becomes an analyst working 24 hours a day, freeing the sustainability team from repetitive tasks so they can focus on strategic decisions.
Data governance is a critical factor that is often underestimated. Before implementing a knowledge graph, it is necessary to define which data sources are reliable, who owns each metric and how often it is updated. The quality of the graph depends directly on the quality of the input data. A mature corporate intranet incorporates master data management policies, automatic validation and data lineage, so that every environmental indicator has fully traceable provenance. Thus, when an auditor asks about the origin of a figure, the system can show the complete chain of evidence.
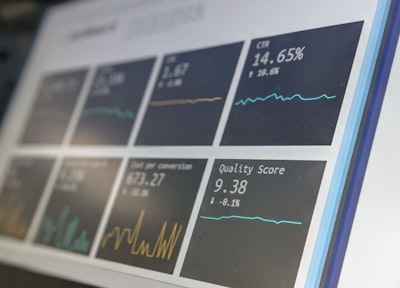
Another pillar of actionable knowledge is reporting. A BI / Power BI platform integrated into the intranet transforms knowledge graph data into clear executive visualizations. Dashboards show the evolution of environmental metrics in real time, compare performance between plants or departments and facilitate communication of results to senior management. Decision-making no longer depends on intuition or outdated spreadsheets. Furthermore, reports can be scheduled to be sent automatically to stakeholders, ensuring that no one loses sight of quarterly targets.
The technology architecture also matters. Hosting the intranet in the cloud with providers such as AWS or Azure offers scalability, availability and advanced AI capabilities. Cloud flexibility is especially valuable when environmental information comes from multiple systems, such as ERP, IoT sensors or supplier platforms. A well-designed cloud architecture allows integrating data in real time, applying advanced analytics and scaling the system as regulatory demands grow.
Speaking of environmental data means speaking of cybersecurity. Information about emissions, audits or climate risks is sensitive and may be subject to regulations. An intranet with knowledge graph must be protected through multi-factor authentication, role-based access control, encryption of data in transit and at rest, and periodic audits. Cybersecurity is a design requirement, not an afterthought. Enterprise solutions must include protection for AI models and connections with on-premises systems, especially when language models process privileged information.
Q2BSTUDIO designs and implements these solutions with a practical, measurable approach. Their team combines experience in web development, enterprise AI and automation to create intranets that not only store knowledge but turn it into operational capability. The business perspective they bring makes it possible to align technology with concrete sustainability goals, defining KPIs from the start and ensuring the system generates real value for the organization. Every project begins with a feasibility analysis and a documented business case, so management knows what return to expect before investing.
The implementation process with Q2BSTUDIO combines agile methodology and business vision. It starts with a discovery phase where current processes, pain points and baseline indicators are mapped. Then a minimum viable product (MVP) is defined, demonstrating the value of the knowledge graph in a real case within a few weeks. The solution is then expanded iteratively, integrating existing systems and adjusting AI models based on user feedback. Ongoing communication and administrator training ensure the client maintains long-term operational autonomy, without creating a permanent dependency on the provider.
Business results usually appear in short periods. Automating environmental reporting reduces manual work hours, traceability improves audit readiness, and real-time visibility enables correcting deviations before they become compliance failures. Companies that integrate AI into their core workflows achieve multiplied impact, and this type of intranet is a clear example of how technology can serve both business and planet.
In short, an intranet with knowledge graph is much more than a document management tool: it is an environmental intelligence platform. By connecting people, data and processes in a secure and scalable environment, organizations can turn their sustainability goals into concrete, measurable and auditable actions. For companies looking for a technology partner capable of bringing this vision to life, custom development with AI and expert integration knowledge is the most reliable path.