The intranet with knowledge graph for continuous improvement has become one of the most powerful levers in modern organizations. Unlike a traditional intranet, which organizes documents into folders and basic search engines, an intranet with a knowledge graph represents concepts, teams, processes, metrics and decisions as connected nodes. That semantic network allows information to stop being isolated and become operational knowledge. For a company, this means shorter improvement cycles, less dependence on individual experts and a real ability to learn from its own data.
Q2BSTUDIO has developed this kind of solution by combining custom software, artificial intelligence and process automation. Continuous improvement is not a slogan: it is a loop of measuring, interpreting, acting and reviewing. A knowledge graph intranet fits into that loop because it captures operational information at the moment it is generated. When a team documents an incident, updates a procedure or records a metric, the graph links that data with the corresponding process, with the people responsible and with company objectives. In this way, periodic reviews no longer depend on manual reports and become conversations supported by data in context.
The value is in semantics. A graph not only says what a document is; it says what it means, who it affects, which metric it monitors and which action came from it. That richness of relationships enables the organization to detect bottlenecks, reuse best practices and keep knowledge from being trapped in emails or in the heads of key employees. Defining ontologies, automatic tagging and extracting entities from documents are fundamental pieces of this approach.
Q2BSTUDIO, a software development and technology company, approaches each project with a results-oriented methodology. First, it carries out a discovery phase to map current workflows, the systems in use, baseline indicators and operational constraints. Then it designs a functional MVP in a few weeks, avoiding unnecessary delays and allowing end users to validate the model from the beginning. This incremental approach reduces risk and builds trust in the teams that will use the tool every day.
Integration is another critical factor. A knowledge graph intranet should not be understood as an isolated platform, but as a layer that connects with ERP, CRM, document management systems, office tools and corporate databases. In Q2BSTUDIO projects, APIs, native connectors and integration events are used so the graph automatically feeds from existing sources of truth. In this way, the organization does not need to replace its current systems; value is created by unifying them.
Artificial intelligence adds the interpretation layer. Using language models and AI agents, the intranet can answer natural language questions, summarize complex documentation, suggest process improvements or detect anomalies in indicators. These AI agents work inside the workflow, with human supervision when the decision requires it. Q2BSTUDIO combines public and private models, with deployment on AWS/Azure cloud and secure connectivity options, so that the company keeps control of its data and complies with its governance policies.
Cybersecurity and governance cannot be an afterthought. A knowledge graph contains sensitive information: people, roles, processes, metrics, and it contextualizes decisions. Therefore, the platform must include role-based access control, audit logging, encryption and human review mechanisms. Q2BSTUDIO incorporates cybersecurity into the design, applying secure development practices, penetration testing and infrastructure hardening. In addition, when AI interacts with internal systems, private connections and VPN tunnels are used to avoid unnecessary exposure on the Internet.
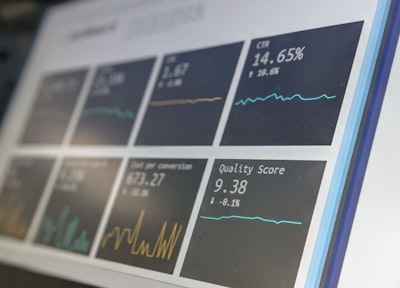
Another pillar is information visualization. A knowledge graph intranet only makes sense if management teams can turn data into decisions. For this reason, Q2BSTUDIO integrates Business Intelligence dashboards and Power BI control panels that show the evolution of key indicators, the status of improvement initiatives and deviation alerts. These dashboards are not just a showcase: they feed on the graph itself so that relationships between metrics remain visible and explainable.
Business results become tangible when the tool is used consistently. Companies that implement this model manage to reduce process times, eliminate repetitive tasks and decrease errors that used to be detected weeks later. Continuous improvement stops being a theoretical exercise: each cycle leaves documented evidence of the change, its economic impact and the lessons learned. Over time, the graph becomes a repository of operational knowledge that increases the value of the organization.
Use cases cover very diverse areas. In onboarding, new employees find a personalized learning path based on their role, projects and the people they will work with. In quality, non-conformities are automatically linked to affected procedures and corrective actions. In equipment or plant maintenance, incidents are connected with the history of interventions and relevant process changes. In human resources and training, the graph identifies skill gaps and proposes internal content to close them.
For a company to be autonomous, the platform must be manageable by the business itself. Q2BSTUDIO develops web administration portals where managers can update keywords, adjust alerts, create new semantic connections and monitor AI usage. This prevents every content change from depending on the technical department and speeds up the improvement cycle. Ownership of source code and delivered documentation allows the client to evolve the system with their own team or with Q2BSTUDIO support in successive phases.
Implementing a knowledge graph intranet does not require a complete digital transformation. It can start with a specific business area, with a limited scope, and then grow to other divisions or countries. Q2BSTUDIO accompanies the organization from the business case definition to daily operations, with a model that prioritizes continuous improvement and return on investment. Companies that have already taken this step have a competitive advantage that is difficult to copy because accumulated knowledge is not just content: it is a structural asset that drives transformation.
In short, the knowledge graph intranet is the technological foundation for continuous improvement. It connects strategy with execution, turns data into knowledge and helps decisions be made with context. For organizations that really want to move forward, the combination of artificial intelligence, custom software and a clear business vision is the natural path. Contact Q2BSTUDIO and find out how to turn continuous improvement into a predictable and measurable result.