An intranet with a knowledge graph is not just an internal search engine; it is a system that relates information, people, and processes so knowledge flows with context. However, technology only shows its value when it is accompanied by a clear measurement model. Defining KPIs before launching the platform lets you separate what works from what is noise and makes it easier to justify the investment to management. Measuring is not a control exercise but a continuous improvement tool.
Traditional intranet indicators—number of visits, downloads, or page views—fall short in a knowledge graph environment. Here you need to know whether semantic connections help solve real problems, whether teams complete their searches successfully, and whether knowledge is updated at the speed the business requires. Therefore, the first step is to build a KPI model aligned with the company's strategic objectives, not only with the interests of the IT area.
A good starting point is to group indicators into layers: adoption, efficiency, quality, business, technology, and governance. Each layer answers a different question: are people using the platform, does it help them work better, is the content reliable, does the investment translate into results, is the infrastructure stable and secure? With this KPI architecture, you avoid dispersion and can prioritize the metrics that actually require action instead of trying to cover everything at once.
Among adoption and usage KPIs, you should monitor daily and monthly active users, percentage of employees who use the intranet at least once a week, number of searches per user, and knowledge contribution rate. It is also useful to measure repeat usage: if a user returns the next day, the tool is delivering value. This data should be captured from day one, ideally with a prior measurement that serves as a baseline. Without an initial reference, it is difficult to attribute improvements to the new system.
Operational efficiency is another critical block. A knowledge graph intranet should reduce the time a person spends finding a policy, a procedure, or an internal expert. You can measure average search time, number of steps to answer, first-contact resolution rate, and percentage of queries resolved without escalating to a human. When you integrate automated processes through custom software, you can also track time saved per task, reduction of manual errors, and number of processes that no longer require manual intervention. These KPIs directly connect the intranet with real business productivity.
Knowledge quality determines trust in the system. A knowledge graph can be technically brilliant but useless if information is outdated or poorly classified. That is why it is advisable to monitor average content age, coverage of the most consulted topics, update frequency, and the rate of expired content that is removed or revised. When the search engine is powered by AI, add an answer accuracy KPI, evaluated by users or through periodic audits. A low accuracy rate invalidates the value proposition of artificial intelligence.
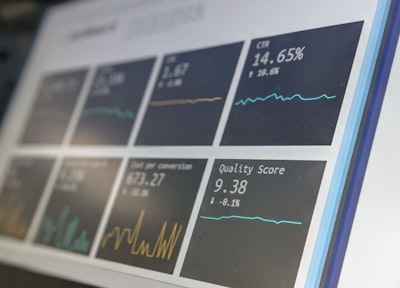
Business impact translates into tangible benefits. From a financial perspective, typical KPIs include return on investment, reduction of operational costs, time freed up in teams, and productivity gains. You can also measure employee satisfaction through internal surveys and retention of key knowledge during staff turnover. The best way to communicate those results is a Business Intelligence dashboard that consolidates intranet metrics with other corporate data; in this sense, a Power BI solution allows you to cross usage KPIs with business indicators and performance trends over time.
Another level of KPIs relates to platform and security. The system must offer high availability, low latency, and acceptable response times for knowledge graph queries, even during usage peaks. You should also measure permission compliance, number of denied accesses, audit events, and cybersecurity incidents. When deploying infrastructure on AWS/Azure cloud, it is advisable to monitor cost per query, performance of managed services, and network configuration efficiency. A custom software development company with experience in these areas can help you set realistic thresholds and early alerts before a problem affects users.
Defining KPIs is useless if they are not visualized with the right frequency. An executive dashboard should include key indicators, their evolution over time, and comparisons with the baseline. For the product team, a weekly review helps detect usage drops or performance issues. For management, a monthly or quarterly review focused on business impact is usually enough. The important thing is that the dashboard tells the system's story and prioritizes alerts, rather than accumulating dozens of metrics without interpretation.
The inclusion of AI agents adds an intelligence layer that requires new KPIs. For example, the rate of automatically generated responses that users accept without modification, the percentage of queries that the agent escalates to a human expert, and the model's average confidence in its answers. You also need to measure human oversight: how many results have been reviewed, corrected, or discarded. These indicators allow you to adjust agents to deliver value without losing quality control. AI is a complement to corporate knowledge, not a substitute, and its metrics should reflect that relationship.
One of the most common mistakes is trying to measure too much at the beginning. If you put thirty KPIs in the first report, the team will lose focus and management will ask for a simplified summary. Another common mistake is not setting a baseline before launching the knowledge graph: without previous data, you cannot demonstrate improvement. It is also important to combine quantitative metrics with qualitative ones; sometimes a survey of a user group explains tool abandonment better than any analytics. Finally, KPIs should be reviewed periodically because business goals change.
In summary, measuring the success of an intranet with a knowledge graph requires a layered approach: adoption, efficiency, quality, business, technology, and governance. Each layer answers a different question and, together, they offer a complete view of the system. Building a solid KPI model not only helps validate the investment but also guides continuous product improvement. Companies like Q2BSTUDIO combine custom software development, AI agents, cybersecurity, and data analytics so these platforms can be managed autonomously and with reliable data. With the right indicators, a knowledge graph intranet stops being a technology project and becomes a competitiveness engine.