The question of whether a knowledge graph intranet reduces human error is increasingly common in executive meetings. The short answer is yes, provided the technology is designed with a clear purpose: giving people and systems context before they make decisions. A knowledge graph is not a more advanced search engine; it is a semantic layer that understands what things are and how they relate. That difference changes how information is used and, above all, how failures are prevented.
To understand its impact, it is useful to compare it with a traditional intranet. In a document repository, information is fragmented: a policy in PDF, a record in Excel, an email that contradicts it. The employee has to interpret and decide which version is valid. In a knowledge graph intranet, data and documents are represented as connected entities: process, owner, customer, system, regulation. When searching, the user does not receive a list of files, but an answer with context. That context is exactly what is missing when an error occurs.
Human error is rarely just an individual mistake. In corporate environments, it is usually the result of information silos, outdated data, lack of visibility or manual handoffs between departments. A knowledge graph reduces those causes because it connects departments, processes and data in a single structure. When someone looks for a critical piece of data, the system can show not only the value, but also the source, the update date and the relationships with other areas. This reduces the possibility of acting on incomplete information.
In addition, the graph enables intelligent validations at the point of entry. An application connected to the graph does not simply check whether a field is filled in; it can check whether the value is coherent with the context. For example, before approving a discount, the system can verify the person's role, the customer's history and the product margin. If a requirement is missing or a contradiction exists, the flow stops and a correction is requested. This kind of control prevents errors that would normally be detected when it is already too late.
Another key point is traceability. When all relevant information is represented as nodes and relationships, it is possible to know who made a change, when, why and what impact it has on other areas. This not only facilitates audits, but also changes team behaviour: they know that their interventions are recorded and that they must be coherent with the rest of the graph. Data governance becomes something applied, not simply documented.
Of course, this capacity for connection requires a solid technological foundation. The knowledge graph does not live in isolation; it integrates with management systems, databases and collaboration tools. To be reliable, it must be protected with cybersecurity measures: role-based access control, encryption in transit and at rest, activity logs and robust authentication mechanisms. A knowledge graph intranet that manages sensitive data without that protection would be an even more dangerous source of errors, because it centralises information in one place.
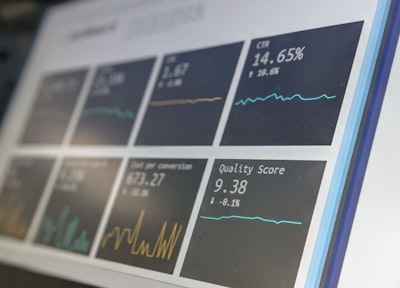
In terms of infrastructure, the most flexible solutions rely on the cloud. Platforms such as AWS or Azure allow the graph to be deployed with high availability and scalability, while securely integrating artificial intelligence services. A Business Intelligence layer complements the graph: data quality indicators, process times and error rates can be displayed in dashboards, for example with Power BI, so that management and teams can identify patterns and act before the problem grows.
The incorporation of artificial intelligence multiplies the effect. A graph-based assistant can answer questions with the right sources, suggest actions and point out inconsistencies that a person would not easily see. AI agents can also perform repetitive tasks within an approved flow: classifying requests, updating records, generating reports. If well configured, they do not replace human judgement; they reinforce it with structured and verifiable data.
Companies that want to obtain these results need more than a generic tool. They need custom applications that adapt to their processes, and an integral vision that combines software development, artificial intelligence, AWS/Azure cloud, cybersecurity and BI/Power BI. Q2BSTUDIO approaches knowledge graph intranet projects from this perspective: first it understands the real process, then it designs the knowledge structure and, finally, it implements the control and automation mechanisms that reduce the margin for error.
A common mistake is to think that simply implementing technology is enough. Experience shows that the greatest risk lies in the quality of the starting data and the clarity of the business rules. If a process is poorly defined, the graph will reflect it. That is why a responsible implementation includes a diagnostic phase, data cleaning, definition of owners and validation with real users. Q2BSTUDIO recommends starting with a specific, high-impact process, measuring the current situation and deploying the graph incrementally.
In business terms, the benefits translate into fewer claims, less rework, faster teams and greater confidence in data. Organisations that implement this type of intranet usually see improvements in employee experience, because endless searches and manual validation tasks disappear. It also improves relationships with customers and suppliers by reducing errors that affect orders, deliveries or billing. Return on investment is justified with concrete indicators, such as onboarding time, resolution time or percentage of incidents caused by internal errors.
Ultimately, going back to the initial question: yes, a knowledge graph intranet reduces human error if it is designed with a clear strategy, solid data governance and the support of a team experienced in advanced technologies. Q2BSTUDIO accompanies companies through that process, not only with software, but also with the knowledge needed to make the organisation more autonomous, secure and efficient.