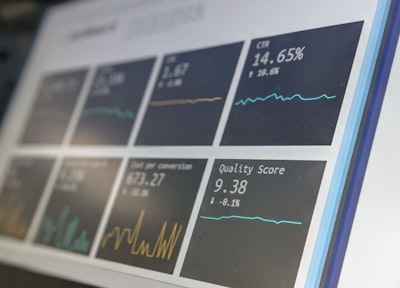
Does business app development include dashboards and reports? The short answer is yes, not because it is a trend, but because an enterprise application without visibility into results is a black box. Organizations need to know what is happening, why it is happening and what can be improved. That is only possible when the app generates structured data, interprets it and presents it clearly to each user profile.
A dashboard is not the same as a report, although both are necessary. The former offers an immediate view of the current situation: daily sales, open incidents, accumulated costs. The latter allows you to examine a specific period, compare variables and obtain a more complete explanation. A mature business solution combines both perspectives. Dashboards help react quickly; reports help plan rigorously.
When a company decides to invest in custom software, reporting must be designed as part of the project, not added later as a patch. At Q2BSTUDIO we design the whole experience: from data collection to the final user screen. This means identifying the real KPIs, the people who consult them and the update frequency. It also requires understanding how information flows between departments, because an indicator on the executive dashboard often starts in the daily operations of a specific team.
Integration with Business Intelligence tools is a qualitative leap. Instead of just showing numbers inside the application, data can be connected with platforms such as Power BI to enrich the analysis. This lets a sales team combine app data with financial, inventory or marketing information and gain a global view that the application alone would not store. This connection relies on APIs and common data models that avoid duplication.
The infrastructure behind reporting is also critical. Deploying the application on cloud environments such as AWS or Azure allows large data volumes to be processed without performance loss. Dashboards can query scalable databases and real-time sources. Cloud elasticity means a report that works with thousands of records in the morning can scale to millions in the afternoon without redesigning the whole solution. Cloud also makes it easier to update testing and production environments.
Artificial intelligence is changing the value of reports. Machine learning models detect patterns, anticipate trends and flag anomalies before they become issues. The latest frontier is AI agents: assistants that not only show a chart but also explain in natural language why a metric has changed and suggest possible causes. This capability brings data analysis closer to non-technical people and turns advanced analytics into an everyday conversation.
In a dashboard, the end user does not need to see every detail. A CEO wants to know profitability and risk; a production manager wants to monitor manufacturing cadence; a customer service lead wants to measure response times. Reports should adapt to each role, with a clear interface and the option to drill down from a global summary to a specific transaction.
Reporting flexibility also depends on the number of output formats. A quarterly report for the board is not the same as an automatic alert for the operations team. A good solution allows building executive, functional and technical reports, each with its own level of detail. Development must cover these scenarios and clearly define who views each report and when.
Cybersecurity is an inseparable requirement of reporting. The data shown on a dashboard is often confidential: invoices, customer information, internal costs. Therefore, every application must include role-based access control, encryption, audit logs and protection against vulnerabilities. Trust in data starts with data security.
In addition to security, reporting depends on data quality and governance. If the source contains errors or duplicate records, the dashboard will show wrong conclusions. A corporate application must include data cleaning, validation and traceability. Current regulations, such as GDPR in Europe, also require personal data to be processed with transparency and consent.
Modern reports also deliver operational value. They allow scheduled distributions, exports to spreadsheets, period comparisons and user cohort analysis. This flexibility is key to keeping a report alive instead of static. Additional reporting can be enabled without releasing a full new version of the application.
Building a truly useful solution starts from the end: what decisions does the user want to make? That question defines the indicators, analysis dimensions and level of detail. At Q2BSTUDIO we work with agile methodologies and constant testing, so clients can see the dashboard evolve in each sprint and adjust course before final delivery.
A dashboard becomes more valuable when connected to systems the company already uses. An application integrated with the ERP can show the full order cycle; one connected to the CRM displays the status of every sales opportunity. This cross-functional view is what turns technology into a competitive advantage and prevents teams from working in information silos.
Creating a business application with dashboards and reports should not be an isolated design exercise. It is a component of digital transformation. When employees trust data, processes accelerate and errors decrease. The technology to achieve this is increasingly accessible, and the maturity of cloud and AI platforms allows even small businesses to compete with solutions that used to be available only to large corporations.
A reporting project does not end when it goes live. Indicators change, business needs evolve and data sources expand. Evolutionary maintenance is as important as the initial development. The platform must be able to add new metrics, modify visualizations and adjust permissions without disrupting the service.
So, does business app development include dashboards and reports? Yes, whenever the company wants to make fact-based decisions. The difference between an app that simply stores data and an app that generates knowledge lies in the quality of its analytics layer. Investing in reporting means investing in the organization's ability to learn and improve continuously.