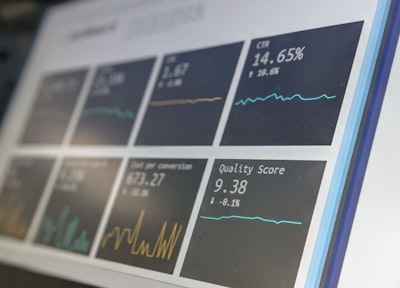
Does business app development include dashboards and reports? The direct answer is yes, and not as a decorative add-on, but as an essential functional layer. A business application without data visibility is a black box: it allows you to operate, but not to learn. That is why modern software projects incorporate dashboards and reports from the start. Q2BSTUDIO, a software and technology development company, treats reporting as part of the solution architecture, not as an afterthought. This changes how organizations adopt technology and measure their return.
In custom software development, dashboards and reports play complementary roles. A dashboard provides a visual, interactive, real-time view of key indicators; a report allows users to drill into, export and audit data in a structured format. Both share the same data foundation, but respond to different needs: the dashboard speeds day-to-day decision-making, while the report supports periodic review, regulatory compliance and strategic analysis. By connecting the application with business systems such as ERP, CRM or sales platforms, custom software development becomes the company's operations hub. Custom software makes it possible to define exactly what metrics are shown, how they are calculated and who can see them, something generic tools rarely achieve.
Companies that still rely on spreadsheets to control their operations know the problem: duplicate versions, formula errors, lack of traceability and poor collaboration. A business application with dashboards and reports solves this by centralizing data and automating its updates. Instead of exporting files, managers see on one screen sales by channel, order status, inventory turnover or service-level agreement compliance. Dashboards can also integrate external data—for example, macroeconomic indicators or supplier information—to enrich analysis. The result is a more transparent operation and an organization able to react quickly.
From a technical point of view, adding dashboards and reports to an application is not trivial. It involves defining data models, query services, performance caches and access policies. When a metric must appear on a dashboard with subsecond latency, the database, API and frontend must be designed to handle that demand. For distributed or high-volume applications, using AWS/Azure cloud is common: it provides elasticity, high availability and storage services that adapt to load. Cloud infrastructures also make it easier to integrate data pipelines, so reports can consume historical and real-time information without degrading user experience. Good software development combines these architectural decisions with a human-centred design.
Another key issue is the relationship between the application and corporate Business Intelligence platforms. An embedded dashboard inside the app does not replace a corporate BI environment; it complements it. Organizations often have prior investments in tools such as Power BI, Tableau or Qlik. Application development must therefore consider exporting data through APIs, generating datasets ready for analysis, and communicating with those platforms. For example, a commercial management application can feed a Power BI cube so the finance team can perform advanced analysis. Business Intelligence with Power BI allows crossing the operational data generated by the app with other corporate data, offering a 360-degree view that would not be possible with a single system. Therefore, business app development must include technical interoperability mechanisms with these tools from the outset.
The next level is artificial intelligence. Static dashboards are no longer enough; companies want to know not only what happened, but what could happen. This is where machine learning and, more specifically, AI agents come in. These agents can analyse time series, identify anomalies, relate variables and generate plain-language explanations about changes in indicators. For example, an AI agent can warn that an increase in returns is correlated with a particular promotional campaign, or suggest the optimal inventory level for the coming weeks. Integrating these capabilities into custom software provides a powerful competitive advantage, because it turns data into actionable recommendations. This requires strong data governance and an AI strategy aligned with the business.
You cannot talk about dashboards and reports without talking about cybersecurity. The data shown in these elements is often critical: billing, customer data, internal costs or HR information. If an application does not properly protect access to reports, it is exposing the heart of the business. That is why development must include robust authentication, role-based access control, encryption in transit and at rest, and auditing of who views or downloads each report. Penetration testing and cloud configuration reviews are common practices that should be part of any project. A responsible cybersecurity approach ensures that reporting does not become an attack vector. Q2BSTUDIO applies these practices in its developments so that information remains a protected asset.
In practice, the dashboards and reports of a business application must be built around strategy. There is no point showing hundreds of charts if people do not know which metric matters. A good reporting system begins by identifying the critical indicators for each role: the commercial director needs a funnel view and revenue projection; the operations manager needs service levels, cycle times and error rates; the customer experience manager needs satisfaction, churn and issue resolution. Regulatory reports, meanwhile, must be generated automatically and with traceability and standard formats. Designing this into custom software development is the difference between software that informs and software that transforms.
In addition, the reporting system must be maintainable. If every new business question requires a code change, the technology department becomes a bottleneck. A better practice is to give advanced users exploration tools within the application itself, with combinable filters, custom views and export to other systems. This autonomy not only frees the development team, but also fosters a data-driven culture. User experience also matters: a dashboard that loads slowly, is not readable on mobile, or forces users to navigate too many screens will eventually be abandoned. Therefore, application development must balance visual richness with performance, simplicity and scalability.
Q2BSTUDIO, as a software and technology development company, tackles these challenges with a methodology that combines process analysis, cloud architecture and product design. Its services include building custom applications on AWS or Azure, integrating with ERP/CRM systems, developing APIs and configuring Business Intelligence environments. The goal is not to deliver code that works, but to create a system that generates measurable impact on efficiency, cost reduction or revenue growth. That is why dashboards and reports are defined together with the client, validating assumptions and adjusting metrics throughout the project. This perspective turns reporting into a continuous improvement tool, not decorative documentation.
Finally, it is worth clarifying a common doubt: to what extent do dashboards inside the application replace a BI department? The answer is that there is no single formula. It depends on organizational size, analytical maturity and the number of data sources. A small company can run with its application and a couple of well-designed dashboards; a large corporation will also need a centralized BI layer. Both scenarios are valid as long as there is a coherent architecture. Thinking about this from the beginning of business app development avoids data silos, double counting and version conflicts between departments. Technology should be an enabler, and reporting is one of its most direct expressions.
In conclusion, business app development does include dashboards and reports, and it always should. The question is not whether to add these elements, but how to design them so that they respond to strategy, respect security and are technically sustainable. With the right combination of custom software, cloud, AI and Business Intelligence, a company can turn its data into a real competitive advantage. Whoever decides to take this path needs a technological partner that understands both programming and business. That is where Q2BSTUDIO adds value: turning an operational tool into an intelligent decision hub.