The corporate intranet can no longer be understood as a simple file repository. In an environment where information multiplies across multiple platforms, the challenge is not storage but connection. An intranet with a knowledge graph allows technical, commercial and operational data to coexist in the same ecosystem and relate to one another by meaning, context and proximity. That changes the way people access knowledge and turns the internal platform into a strategic tool for improving results.
Many companies have invested in SharePoint, Teams, ERPs, CRMs and traditional databases, but information remains fragmented. Employees waste time looking for documents, identifying owners or reconstructing decisions already made. A knowledge graph is not an isolated technology: it is a layer placed on top of the existing infrastructure to understand what each piece of data means and who uses it. Instead of returning a list of files, it answers questions such as 'which reports are related to this customer' or 'who is the person with the most experience in this process'.
The difference from a traditional search engine is semantics. A machine working with a graph learns the links between company objects. If a production document mentions a machine and a quality report contains that same machine, the graph establishes the relationship. If a person works on a project and another employee has solved a similar issue, the graph suggests a connection. This inference capability is the foundation of artificial intelligence applied to internal processes.
For the graph to work, data must be connected and clean. System integration is a critical step. Organizations usually have data scattered across the ERP, the CRM, the document repository and spreadsheets. At Q2BSTUDIO we design the unified data model, define business rules and create an integration layer that extracts information from each source without disrupting operations. This way, the graph is fed with reliable and up-to-date data.
The artificial intelligence component adds a conversational and recommendation layer. Using techniques such as RAG and private language models, the intranet can provide contextual answers based on internal documents, with traceability and control. Instead of the user searching manually, the assistant understands the intent and returns an answer together with the supporting sources. In addition, AI agents can execute automated tasks: create a ticket, update a record, send an alert or prepare a meeting summary.
For this to be sustainable in a company, more than a language model is needed. A secure and scalable architecture is required. In our projects we use cloud infrastructure, usually AWS or Azure, with encryption, identity management and monitoring. Cybersecurity is not an add-on: it is part of the design. We configure VPNs, private networks and endpoint protection when the intranet is connected to on-premises systems. We also define role-based access policies and audit logs to comply with regulations such as GDPR.
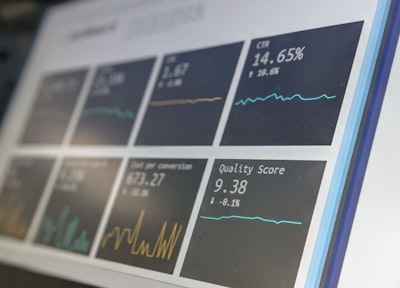
Another pillar is analytics and data visualization. A knowledge graph is not only useful for searching; it also feeds dashboards. With Business Intelligence, for example Power BI, we turn relationships into useful metrics: resolution times, document reuse level, knowledge gaps, workload by team. These indicators help managers detect problems and make decisions based on observable data, not intuition.
At Q2BSTUDIO we understand that every organization has its own way of working. That is why we work with custom application development: internal platforms designed for the company's real processes, not for a generic standard. A knowledge graph needs to adapt to the organization's vocabulary, systems and culture. It is not implemented the same way in an industrial company, a consultancy or a hospital. User experience, navigation and approval flows must be designed from the context.
The implementation methodology must be pragmatic. We start with a discovery phase in which we analyze data sources, critical processes and key users. Then we build an MVP in a few weeks with a reduced scope: a concrete use case, for example semantic search on quality documents or an assistant for the support department. From there we iterate, measure and expand the graph with new sources and functionalities.
Results are visible in daily operations. Employees spend less time searching for information; support teams resolve issues faster; product managers detect trends that were previously hidden. In business terms, this translates into higher productivity, fewer errors and a better employee experience. Technology is not the end, but the means to turn knowledge into action.
Some recurring use cases are onboarding new employees, finding internal experts, automating administrative processes and customer support. In onboarding, the graph shows the new employee key people, work guides and related previous projects. In support, the assistant analyzes the knowledge base and proposes tested solutions. In automation, an AI agent updates data across systems and triggers workflows when conditions are met.
The intranet with a knowledge graph is also a commitment to autonomy. When information is connected, teams are less dependent on asking a colleague or writing emails to locate a piece of data. The organization becomes more agile because people find the knowledge exactly when they need it. This agility is especially valuable in companies with distributed teams or high turnover.
At Q2BSTUDIO we combine custom software development, artificial intelligence, cybersecurity, AWS/Azure cloud, BI and automation to create intranets that are true data engines. Our team works with the client so that the system reflects their real operation, with concrete indicators and a clear roadmap. We believe that an internal solution should be understandable for those who use it and manageable by the team itself, without unnecessary dependencies.
The next step for many companies is not buying more software, but connecting what they already have. A knowledge graph makes it possible to take advantage of existing data and turn it into a competitive edge. This is where the difference appears between investing in technology and building an internal capability: the company that understands its internal relationships can anticipate, correct and improve continuously.