When a company asks about app development for business, the real question is not what screens the application will have, but what measurable results it will generate. Technology is the means; operational profitability is the end. An app that does not improve a relevant figure is a well-executed development, but poorly conceived.
Organizations no longer invest in technology for the sake of fashion. Boards demand return, deadlines and evidence. That is why defining indicators from day one is as important as choosing the architecture or the language. Without metrics, any project is a bet; with metrics, it becomes a controlled investment.
Custom software development offers a clear advantage: it adapts the solution to the real flows of the business. Custom software development makes it possible to remove manual processes, reduce data-entry errors and create a unique experience for customers, employees or suppliers. The immediate question is how to know whether that difference translates into numbers.
The answer begins with a baseline. You have to measure before starting: how long a process takes, how many errors are made, how many orders are lost, what percentage of customers repeat a purchase. That initial snapshot makes it possible to compare the real impact of the application after launch.
From there, each company must choose the indicators that truly reflect its strategy. Some businesses prioritize delivery speed; others, data accuracy; others, the claims rate. There is no universal KPI template, but all KPIs share one condition: they must be connected to a concrete decision.
Still, some metrics appear frequently in practice. For example, the cycle time of a service, the number of units processed per person and team, the rate of compliance incidents, purchase recurrence or the staff’s perception of workload. What matters is not to list them, but to verify that each one has an owner, a collection method and a success threshold.
To make these results comparable, it is useful to set KPIs at three levels: operational, tactical and strategic. The operational level measures day-to-day activity: response times, resource utilization, error rate. The tactical level connects processes: opportunity conversion, delivery compliance, cost per service. The strategic level answers the company’s objectives: margin, growth and customer value.
At Q2BSTUDIO we apply this methodology with each client. Before writing a line of code, we spend time understanding where the friction is and what indicator needs to move. That changes the role of development: it stops being a technical delivery and becomes a transformation lever.
The chosen technology also determines which results are achievable. An application on AWS/Azure cloud can scale in hours, withstand demand spikes and reduce infrastructure costs compared with a traditional server. AWS/Azure cloud services also make it possible to incorporate advanced analytics and managed security services, two factors that increase delivery speed and business confidence.
Cybersecurity is another measurable indicator. A security breach causes direct costs, sanctions and reputational damage. When an app is developed with robust authentication, encryption and penetration testing, risk drops. At Q2BSTUDIO we integrate cybersecurity across the life cycle, not as a final layer, so deployments are secure by default.
Artificial intelligence adds an analytical dimension to app development. An AI agent can read invoices, classify tickets, answer employee questions or detect anomalies in a sequence of operations. It is not about replacing people, but about freeing time for tasks that require judgment. Apps with AI do not only automate; they learn from every interaction and improve their responses.
That is why, when we evaluate a development request, we ask about available data. An app that collects information from the first moment feeds artificial intelligence models and control panels. AI and AI agents are more effective when the data foundation is clean, structured and accessible in real time.
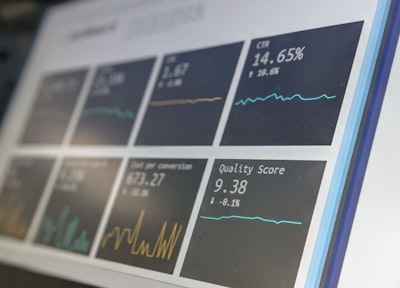
To measure the performance of an application, web analytics alone is not enough. In corporate environments, operational, financial and customer data must be connected. Business Intelligence and Power BI solutions are the natural bridge between the application and decision-making. A well-designed dashboard shows the status of each KPI, its trend and the root cause of a deviation.
A dashboard built with Power BI can update in real time and alert when a process stops. The ability to monitor operational performance from any device multiplies the value of the investment. There is no longer any need to wait for the monthly report.
An example may help. A facility maintenance company had difficulty coordinating field technicians. After developing a custom app with intelligent routes and a tracking dashboard, it reduced travel times by 23%, increased the number of jobs completed per day and improved end-customer satisfaction. None of those results was a coincidence: they were defined before starting.
Another common case is the customer service department. An app that uses AI agents to classify inquiries can automatically route complex cases to the right specialist. The measurable effect is a reduction in response time and an increase in first-contact resolution, two KPIs that directly affect retention.
Process automation is also reflected in financial results. By eliminating manual tasks such as entering data into an ERP or validating documents, labor hours, errors and claims are reduced. The return does not always appear as new income; it appears as avoided cost and capacity freed up for higher-value projects.
One of the reasons development projects fail is the lack of clarity about expected results. Technical teams build more functions than necessary and a business does not know what it is funding. The solution is not to write longer requirements, but to agree on which indicator must improve and how it will be measured.
Some measurable results do not appear in the first month. Reducing user churn, increasing customer lifetime value or improving the net promoter score are effects that accumulate. A good measurement plan must consider short, medium and long-term horizons.
It is also important to assign a data owner and a review cadence. A KPI without an owner is a statistic with no consequences. In the projects we accompany, we define who updates the data, who reviews the dashboard and what decision is made when a metric deviates.
The success of AI is also measured. It is not enough to have a trained model; you have to observe whether it reduces effort per case, improves classification accuracy or increases conversion from recommendations. At Q2BSTUDIO we define acceptance criteria for each AI agent before moving it to production.
The cloud has its own indicator: cost per transaction, availability time, average latency. If an app is deployed on AWS/Azure, it is possible to adjust consumed capacity and optimize monthly spending. This turns infrastructure into a performance variable, not a fixed budget line.
The most valuable applications are those that do not live in isolation. Connecting to the CRM makes it possible to measure commercial behavior; connecting to the ERP makes it possible to reflect financial impact. That is why a development strategy requires planning integrations from design, not as an afterthought.
At Q2BSTUDIO we combine technical capability and business vision. We do not only build code: we design a complete solution, from user experience to cloud infrastructure, including data quality and system protection. Our goal is that at the end of the project, the client can show a dashboard with evidence of impact.
When choosing a technology partner, it is worth reviewing its experience with integrations, its security approach and the way it approaches measurement. A company that asks about your KPIs from the first meeting is a sign that it understands what matters. Software development does not end with deployment; it ends when the organization uses the app and improves its numbers.
The recommendation is to start with a small, well-scoped project that responds to a specific pain point. Choose one primary metric and one or two secondary metrics. Implement the solution, measure over at least two or three operating cycles and compare with the baseline. That pilot builds trust and provides data to expand the investment.
Finally, it is important to remember that technology evolves. A conventional app built today can incorporate artificial intelligence tomorrow or connect to a cloud ecosystem. For this reason, it is advisable to choose a technological foundation that allows growth without redoing the work. Modularity, API design and open integrations are as important as visible functions.
In short, business app development must be seen as an investment with verifiable return. Metrics are the common language between technology and management. Whoever defines what to measure first, hires better, implements faster and obtains stronger results. Q2BSTUDIO is ready to be that partner: a team that understands code, data and business.