DEVELOPMENT · INTEGRATIONS AND APIS · DASHBOARD / DASHBOARD · POWER BI

Colonial — Integración de datos y Business Intelligence

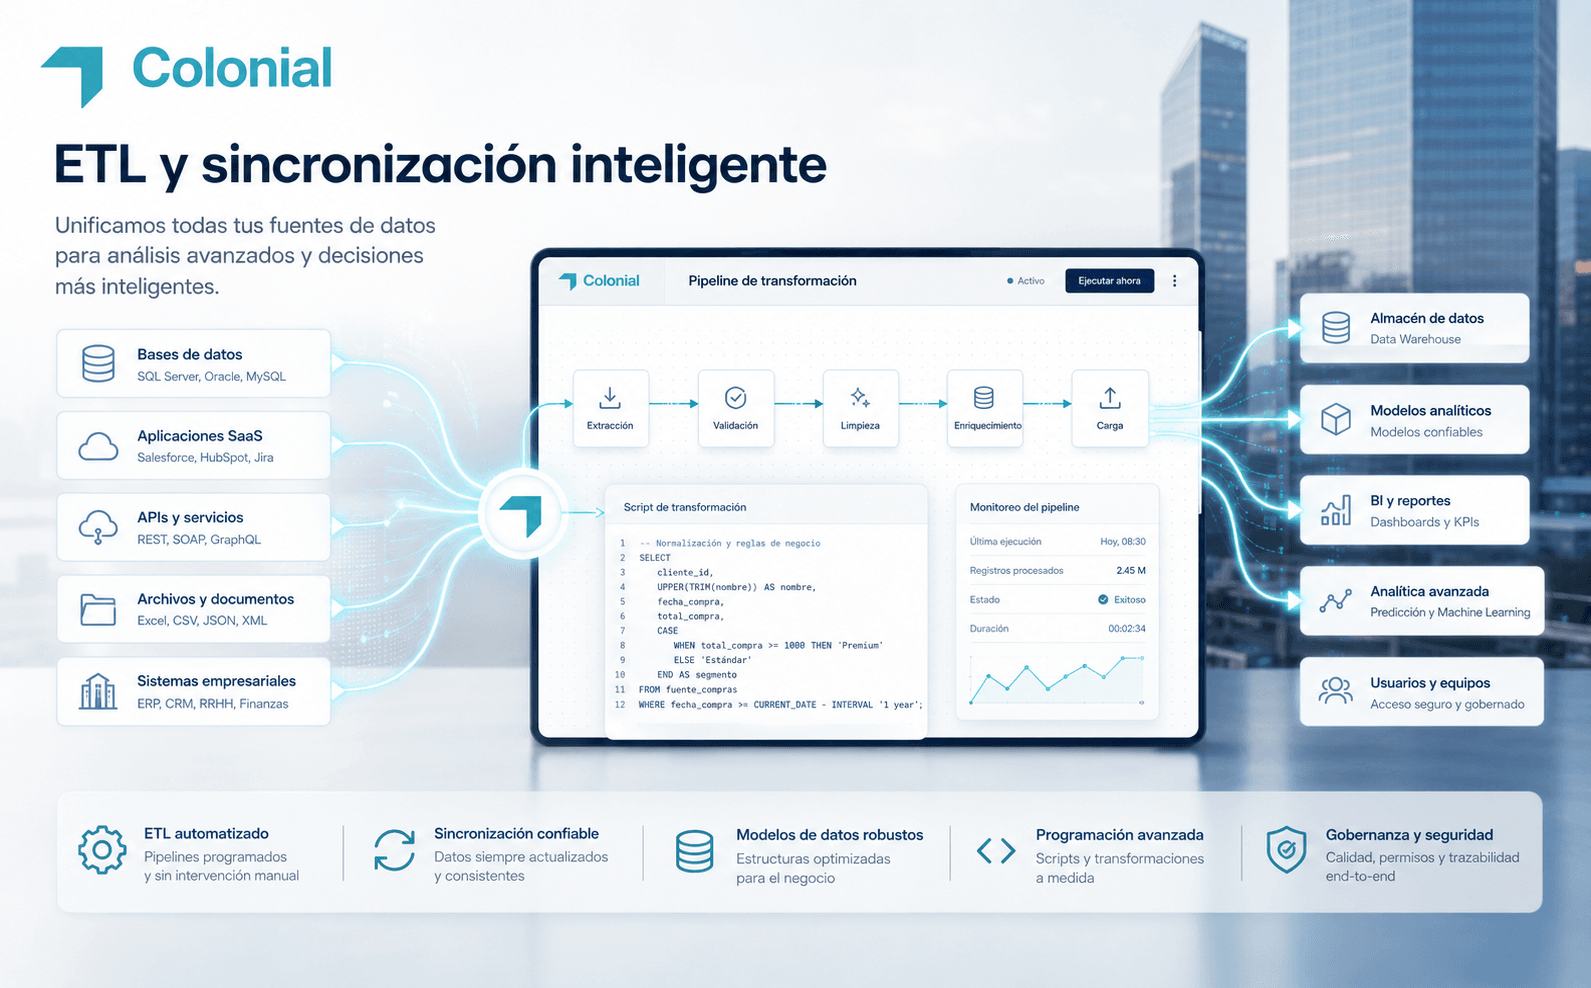
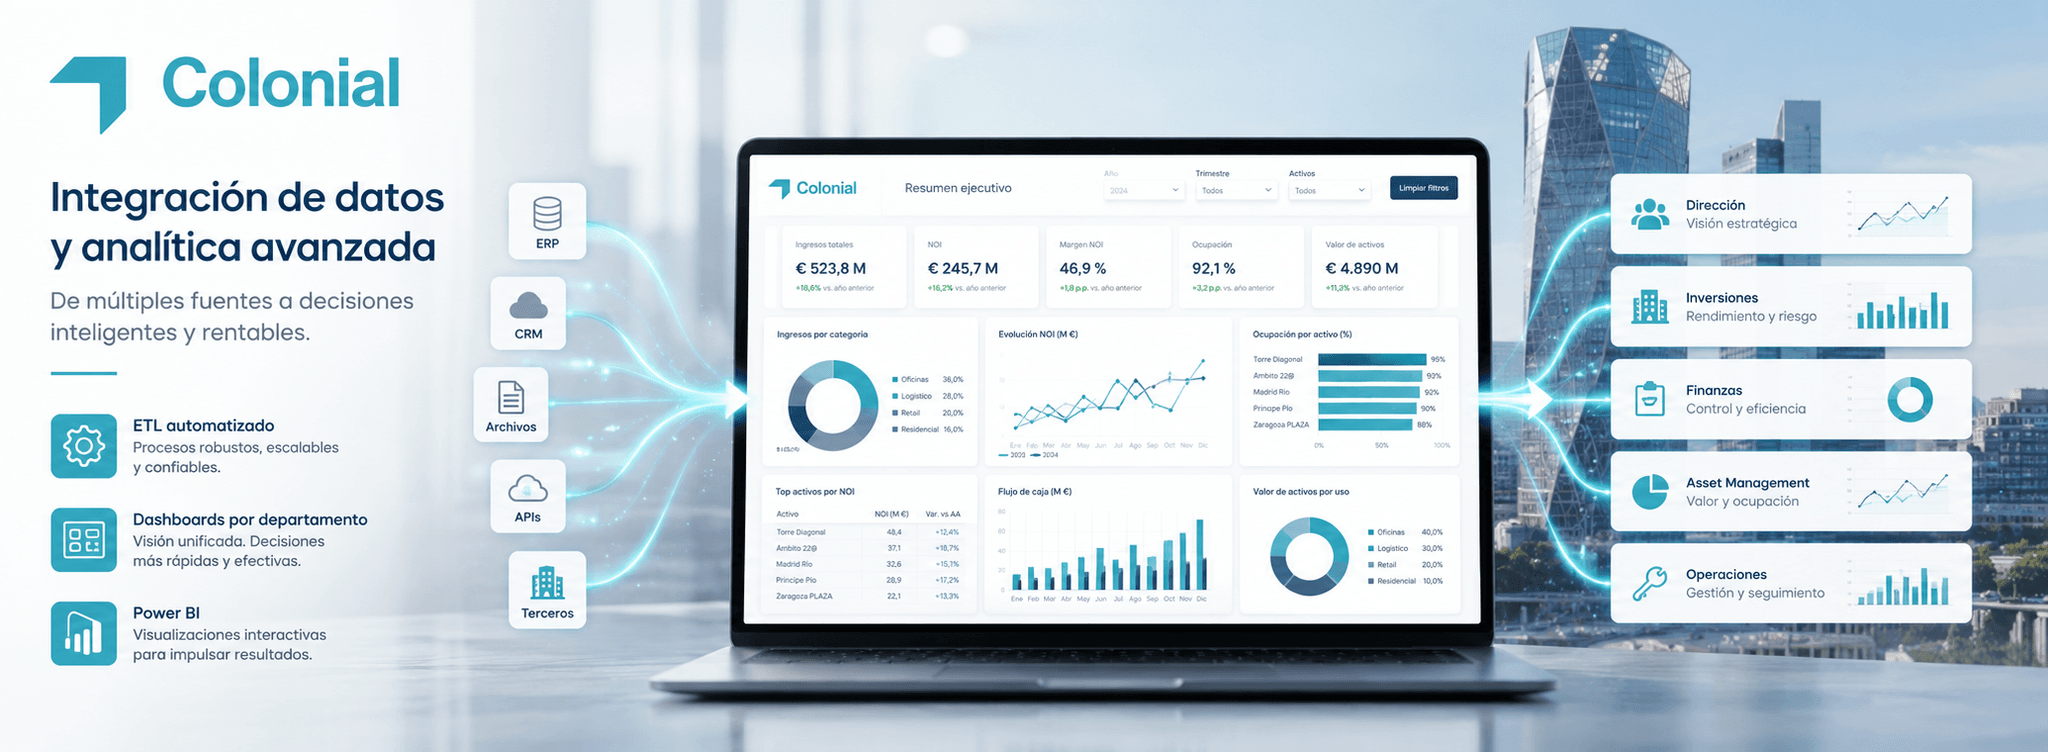
Development of a data integration, transformation and analysis solution that connects different corporate sources and converts them into Power BI dashboards adapted to the specific needs of each department. The platform makes it easy to track indicators, compare information, and generate advanced visual analytics from a centralized environment.

0:000:00

The challenge

Turn dispersed data sources into reliable, consistent, and business-critical information

Colonial needed to leverage information from different systems, departments, and formats. The data did not always share the same structure, could be duplicated, or required manual processes before being prepared for analysis.

The challenge was to design processes capable of extracting, transforming and unifying all this information, ensuring that the indicators used by the different teams were consistent and up-to-date.

In addition, each department needed a different view of the business. It was not enough to create a generic dashboard: models, metrics, filters and visualizations had to be adapted to specific objectives, allowing the information to be analyzed from different perspectives and levels of detail.

The solution also needed to support advanced calculations, complex relationships between data, and specialized charts that helped detect trends, deviations, and opportunities for improvement.
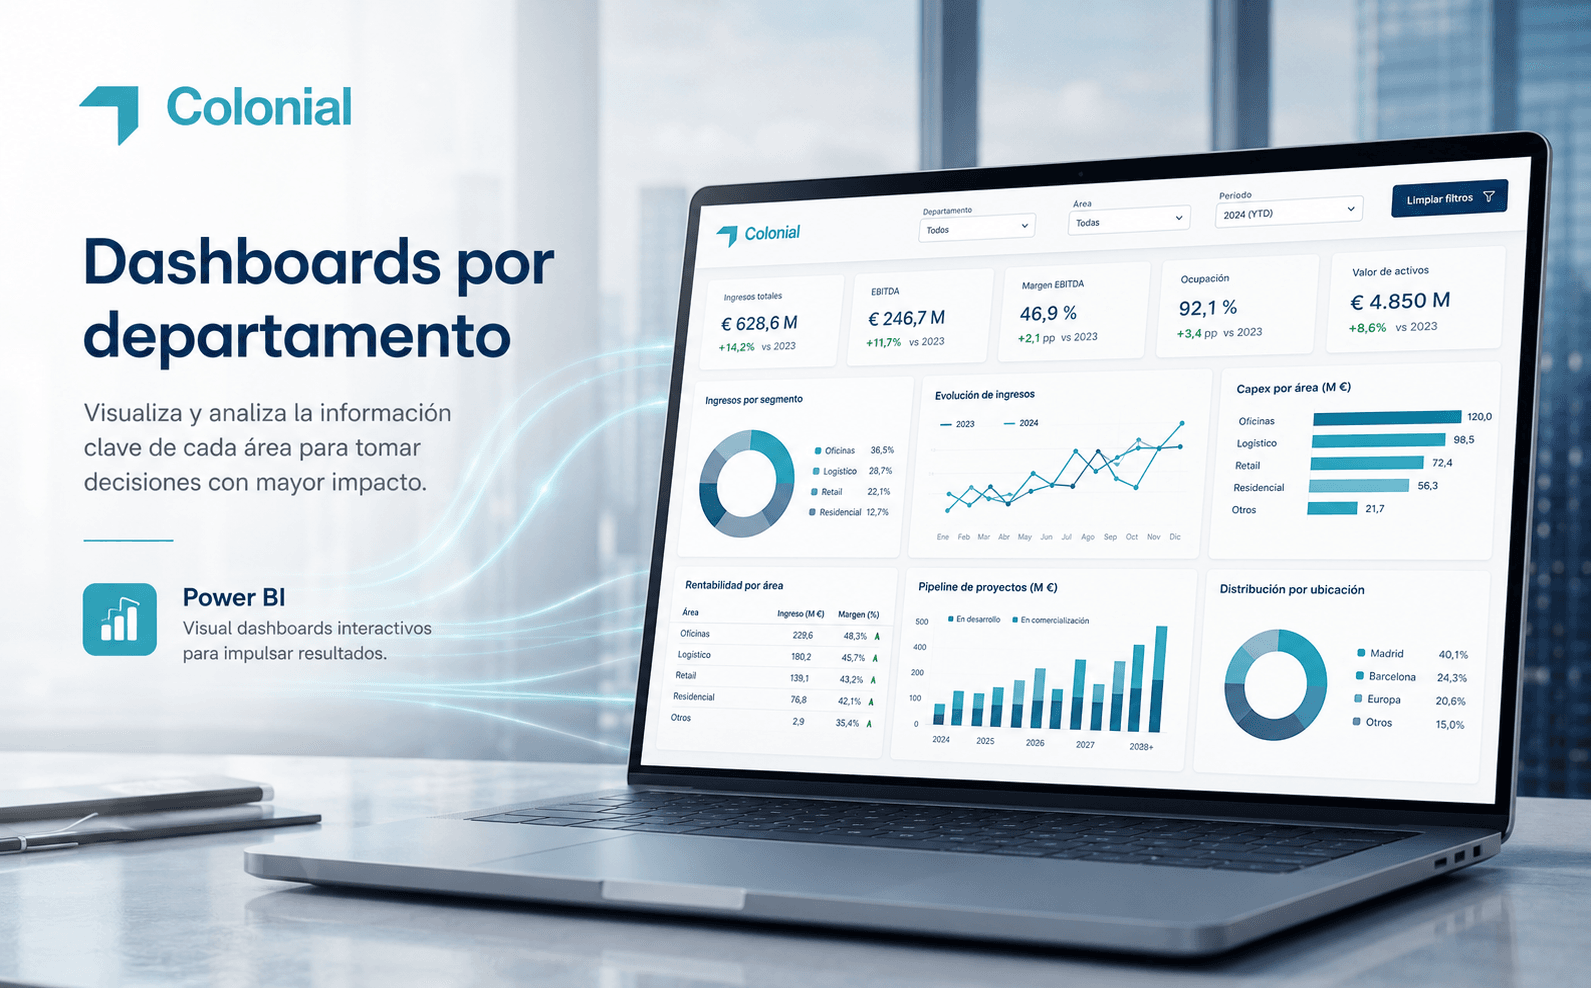
The solution

A connected data ecosystem with dashboards tailored to each area

  • Multi-source integration
  • Automated ETL processes
  • Consolidated and reliable data
  • Adapted models by department
  • Dashboards Power BI
  • Real-time indicators
  • Advanced Calculations and Programming
  • Specialized graphics
  • Filters and interactive analysis
  • Centralized reporting

KEY FEATURES

What the app can do

  • Connecting Data Sources

    Integration of information from different systems, databases, files and corporate tools.

  • Automated ETL processes

    Extract, transform, and load data using scheduled processes that reduce manual work.

  • Standardization of information

    Unification of formats, fields, nomenclatures and criteria to maintain a coherent structure between all sources.

    • Data Cleansing and Validation

      Detection of duplications, incomplete records, and inconsistencies before incorporating the information into analytical models.

    • Centralized data model

      Centralized data model

Gallery

Inside the product

PROCESS

How we did it

  • Analysis and definition

    We understand your challenge, requirements and goals to define the scope.

  • UX/UI design

    We prototype the experience and the design of each screen.

  • Development

    We build the software with secure, robust and scalable technology.

  • Testing (Q&A)

    We validate quality, performance and security before release.

  • Launch and support

    Go-live and ongoing product evolution.

Do you have a project in mind?

Tell us your vision and we'll turn it into a software solution. Whatever the scope, we make your idea real.

Live Chat