DESIGN · CORPORATE WEBSITE · WEB / SAAS PLATFORM · PORTAL / INTRANET · INTEGRATIONS AND APIS · DASHBOARD / DASHBOARD

Futura Group — Plataforma digital para la gestión energética y la huella de carbono

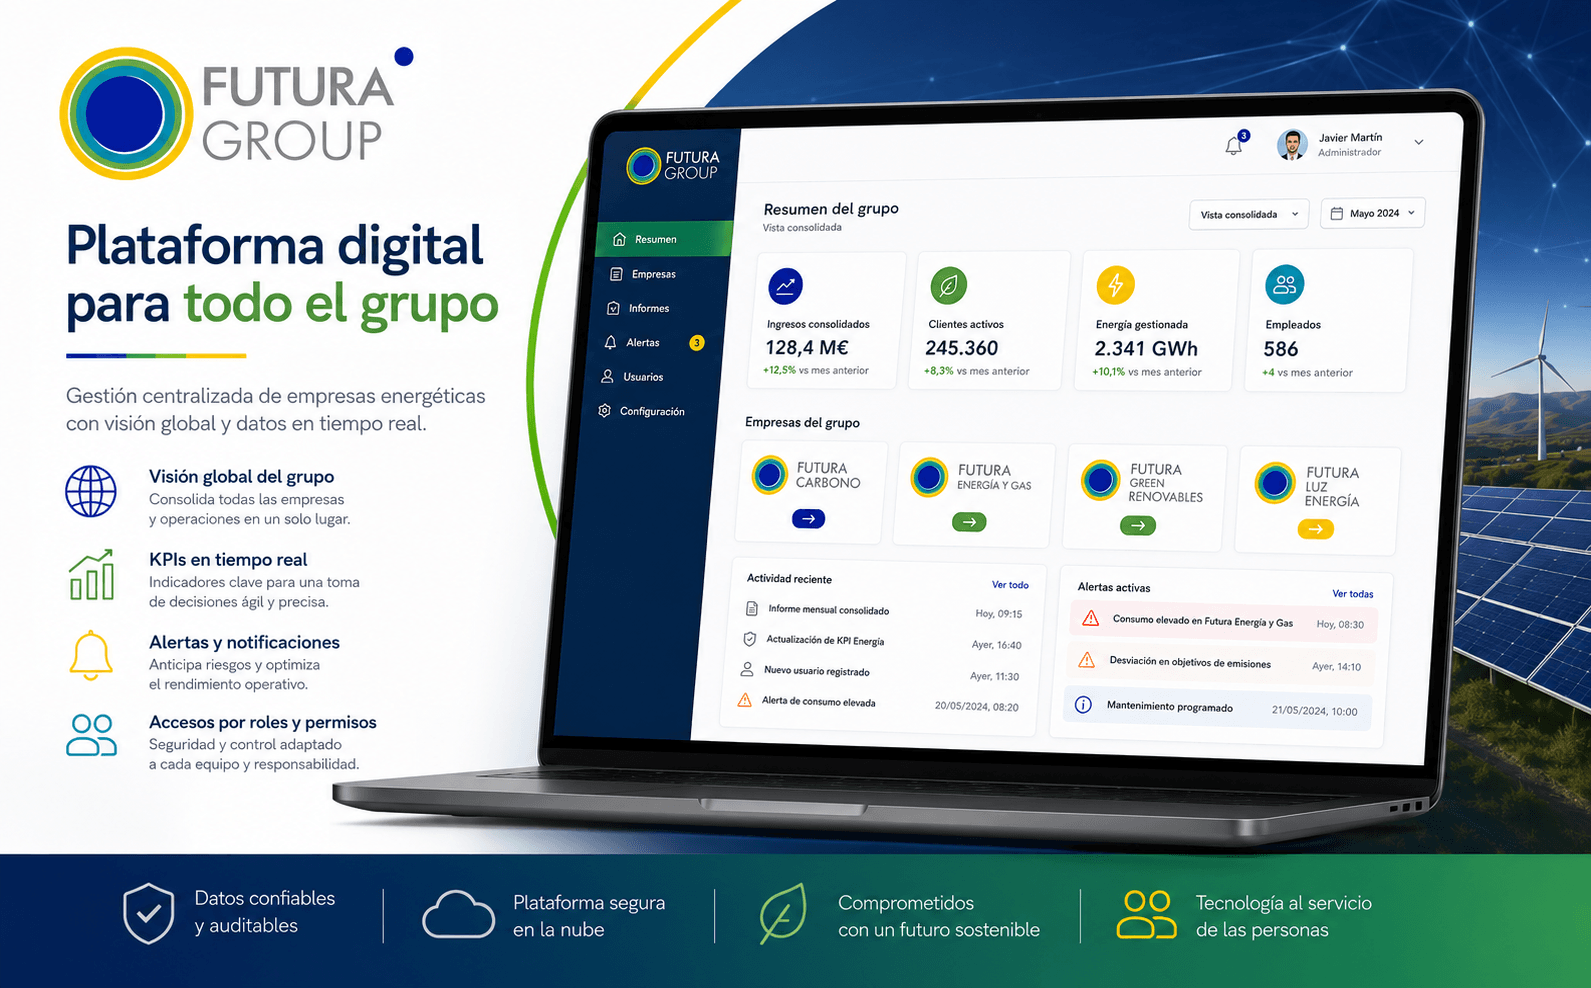
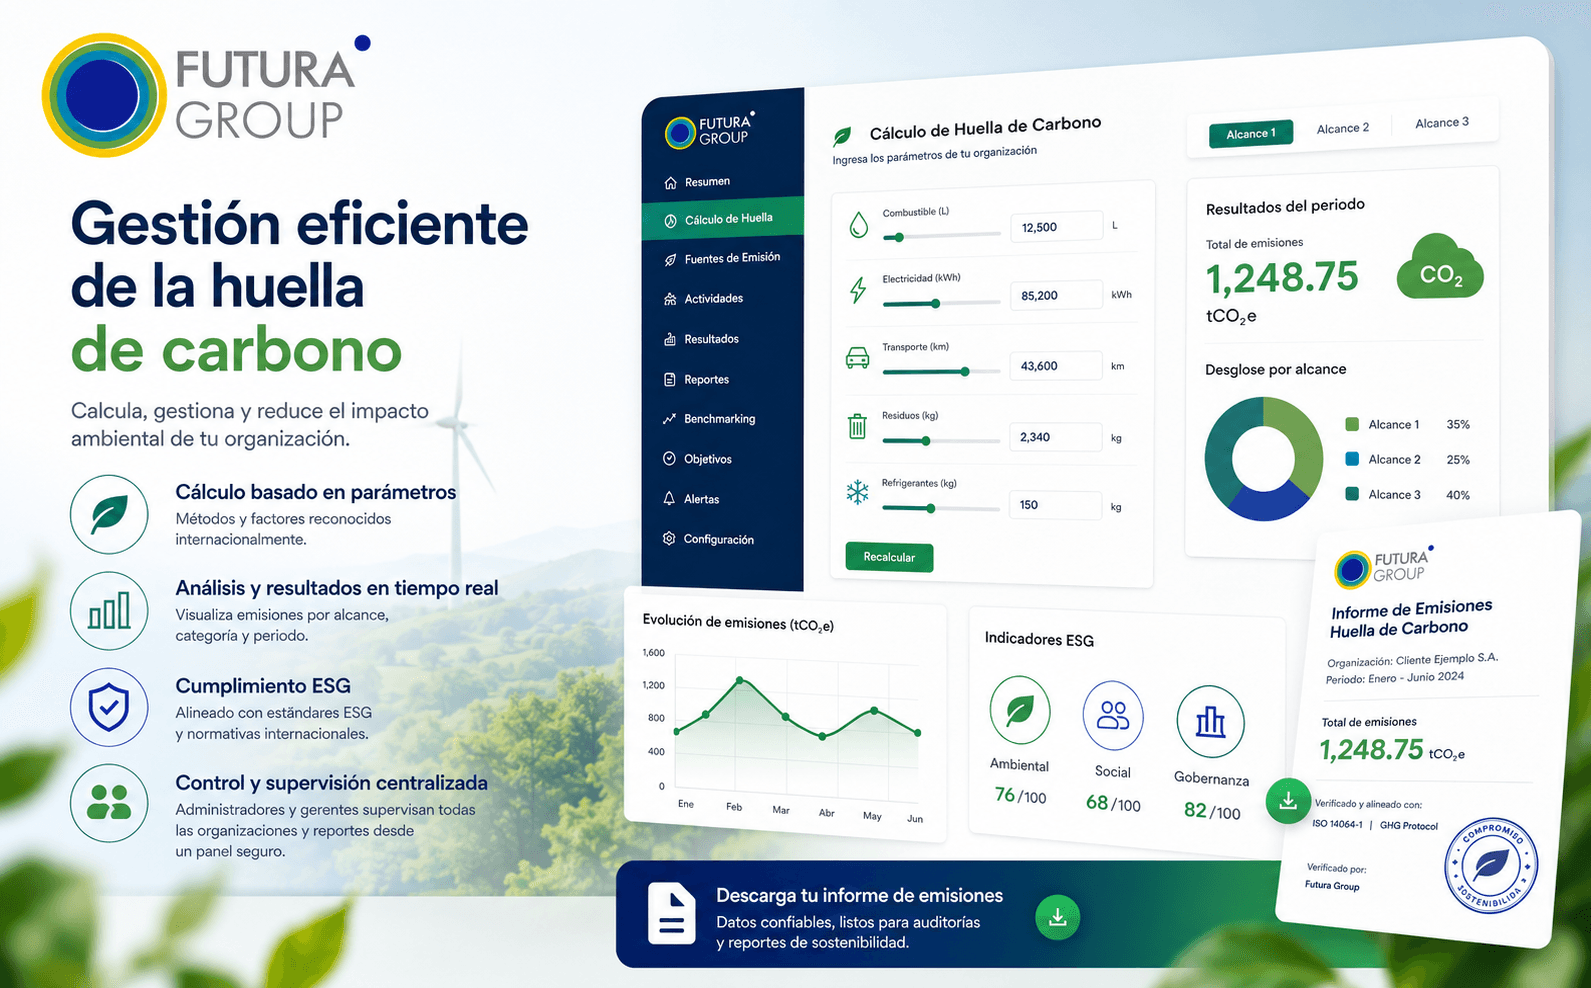
Development of a web platform to centralise the management of the different companies of Futura Group and facilitate the calculation, analysis and monitoring of the carbon footprint of its customers. The solution allows you to enter activity parameters, obtain results by scope, consult environmental indicators and download emission reports.

0:000:00

The challenge

Unify the group's activity and turn environmental data into useful information

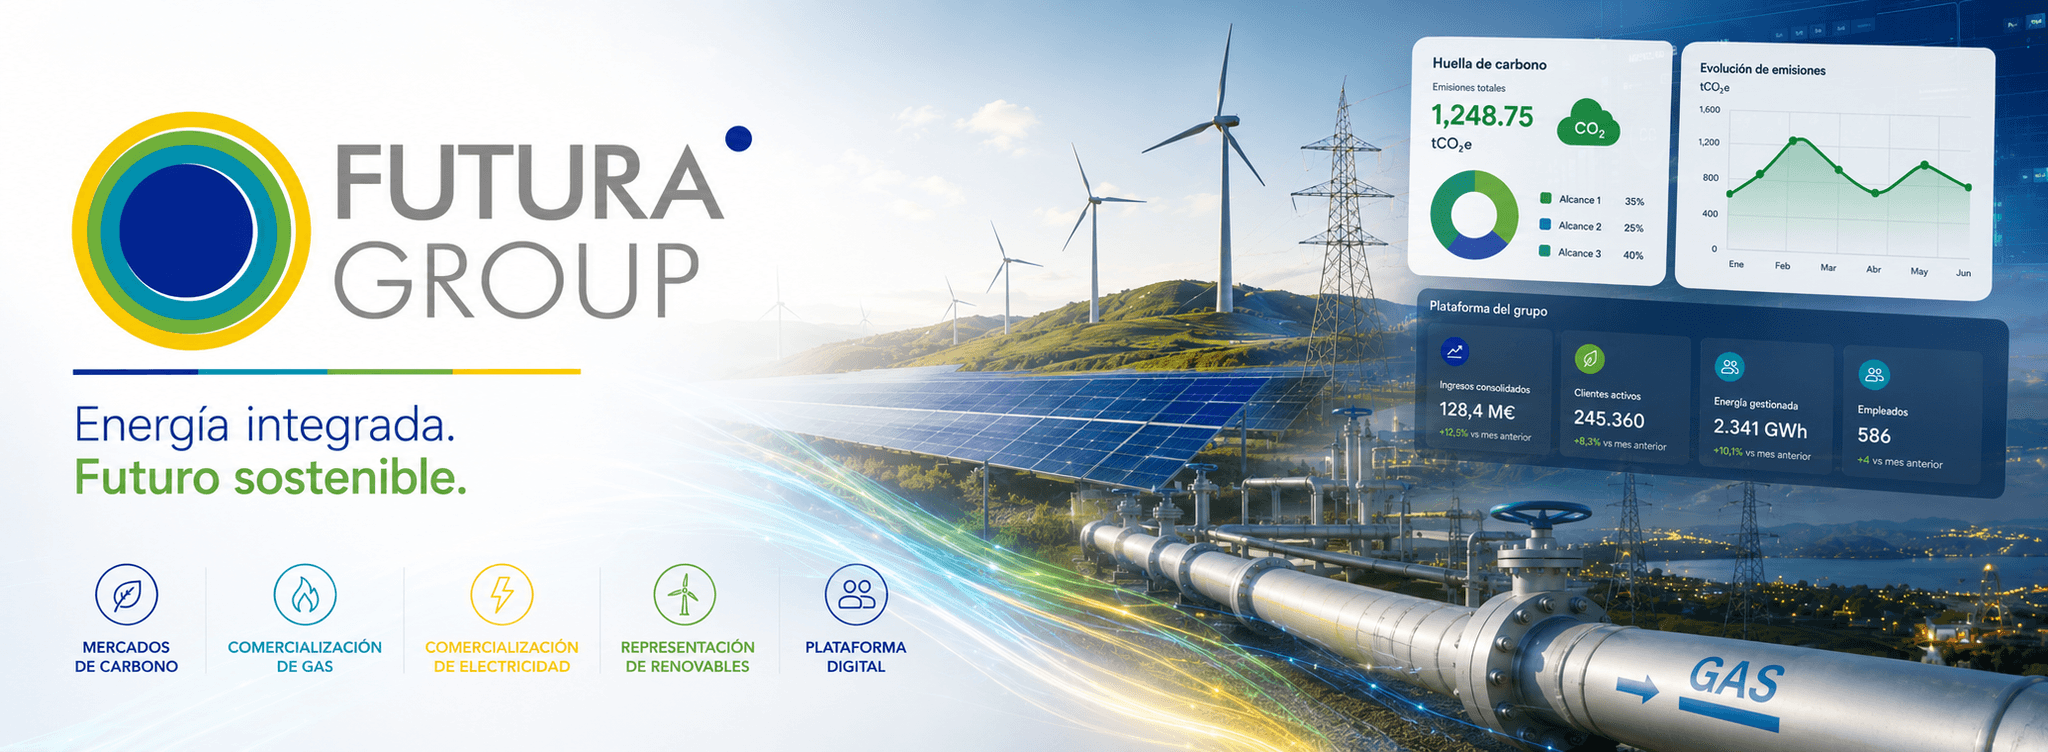
Futura Group is made up of different companies specialising in energy services, carbon markets, gas and electricity trading and representation of renewable energies.

The challenge was to create a common platform from which to consult the activity of the entire group, while maintaining the identity, data and processes of each company.

In addition, it was necessary to develop a tool capable of calculating the carbon footprint of customers based on parameters such as consumption of fuel, electricity, transport, waste or refrigerant gases.

The solution had to transform this data into clear results, differentiated by scope and category, allowing its evolution to be analyzed, reduction objectives to be established and reports prepared for audits or sustainability strategies to be generated.
The solution

A digital ecosystem that connects business management, energy and sustainability

  • Common platform for the whole group
  • Consolidated data model
  • Parameterizable calculation engine
  • Differentiated experience by user
  • Decision-oriented information
  • Secure and scalable architecture

KEY FEATURES

What the app can do

  • Business and customer management

    Administration of the different companies of the group, client organizations, users and managers.

  • Carbon footprint calculation

    Introduction of consumption and activities to calculate the emissions generated during a period.

  • Emissions by Scope and Category

    Breakdown of results according to scopes 1, 2 and 3 and the different sources of issuance.

  • Evolution, objectives and comparisons

    Historical monitoring of emissions, benchmarking and monitoring of progress against reduction targets.

  • Sustainability Reporting

    Generation and download of reports prepared for audits, presentation of results and ESG reporting.

  • Dashboards and alerts

    Consult consolidated KPIs, deviations, recent activity and relevant notices for each company.

Gallery

Inside the product

PROCESS

How we did it

  • Analysis and definition

    We understand your challenge, requirements and goals to define the scope.

  • UX/UI design

    We prototype the experience and the design of each screen.

  • Development

    We build the software with secure, robust and scalable technology.

  • Testing (Q&A)

    We validate quality, performance and security before release.

  • Launch and support

    Go-live and ongoing product evolution.

Do you have a project in mind?

Tell us your vision and we'll turn it into a software solution. Whatever the scope, we make your idea real.

Live Chat